


trend analysis
EUR/USD is likely to rise from 1.1065 (the closing of the March monthly candle) to 1.1169, which is the 23.6% retracement level (dashed blue line). Upon reaching it, the pair will move to the historical resistance level at 1.1302 (blue dotted line), then rollback downwards.
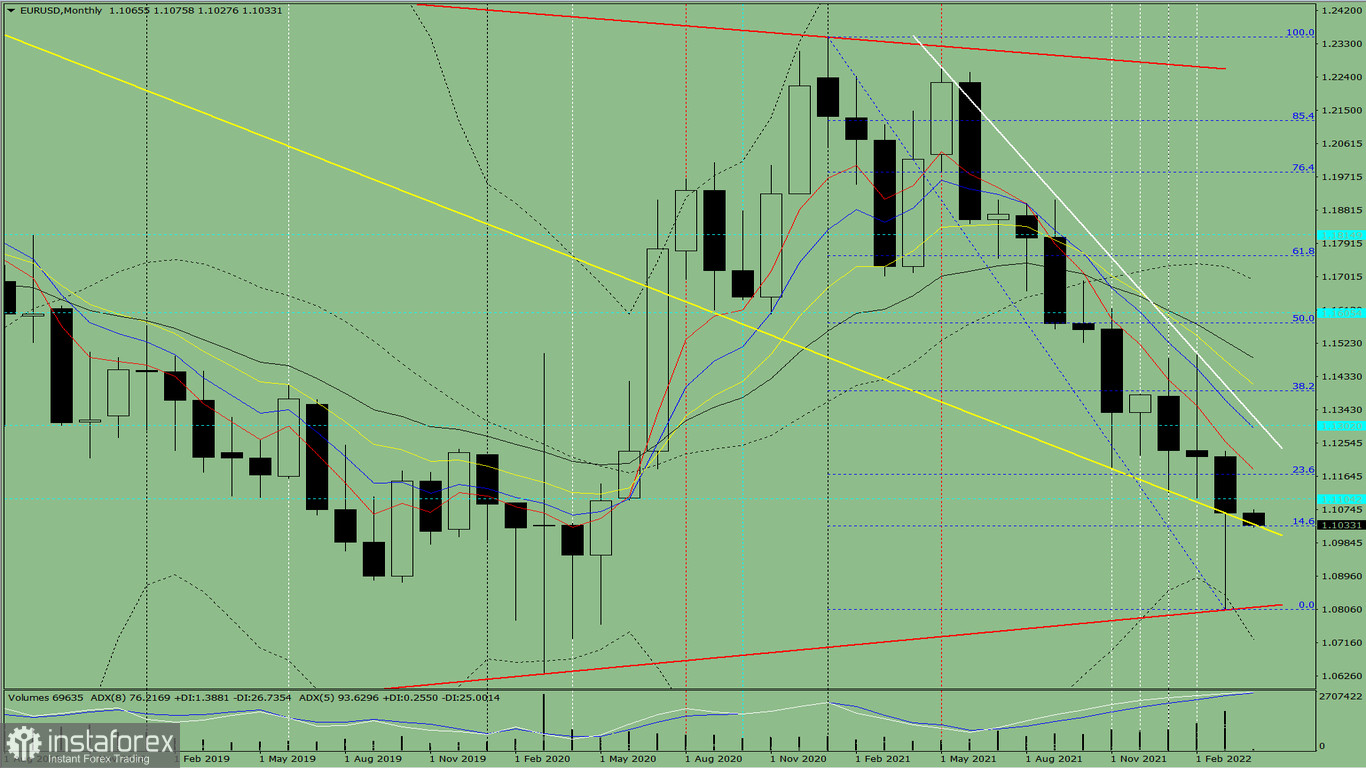
Fig. 1 (daily chart)
Comprehensive analysis:
Indicator analysis - uptrend
Fibonacci levels - uptrend
Volumes - uptrend
Candlestick analysis - uptrend
Trend analysis - uptrend
Bollinger bands - uptrend
All this points to an upward movement in EUR/USD.
Conclusion: The pair will have an upward trend, with no lower shadow on the monthly white candle (the first week of the month is white) and a second upper shadow (the last week is black).
And throughout the month, the pair will climb from 1.1065 (the closing of the March monthly candle) to the 23.6% retracement level at 1.1169 (dashed blue line), then go further up to the historical resistance level at 1.1302 (blue dotted line). A rollback downwards is possible, immediately after the aforementioned price movements.
Alternatively, the pair could decline from 1.1065 (the closing of the March monthly candle) to the lower fractal at 1.08066 (blue dotted line), then bounce back to 1.1030, which is the 14.6% retracement level (dashed blue line).


