


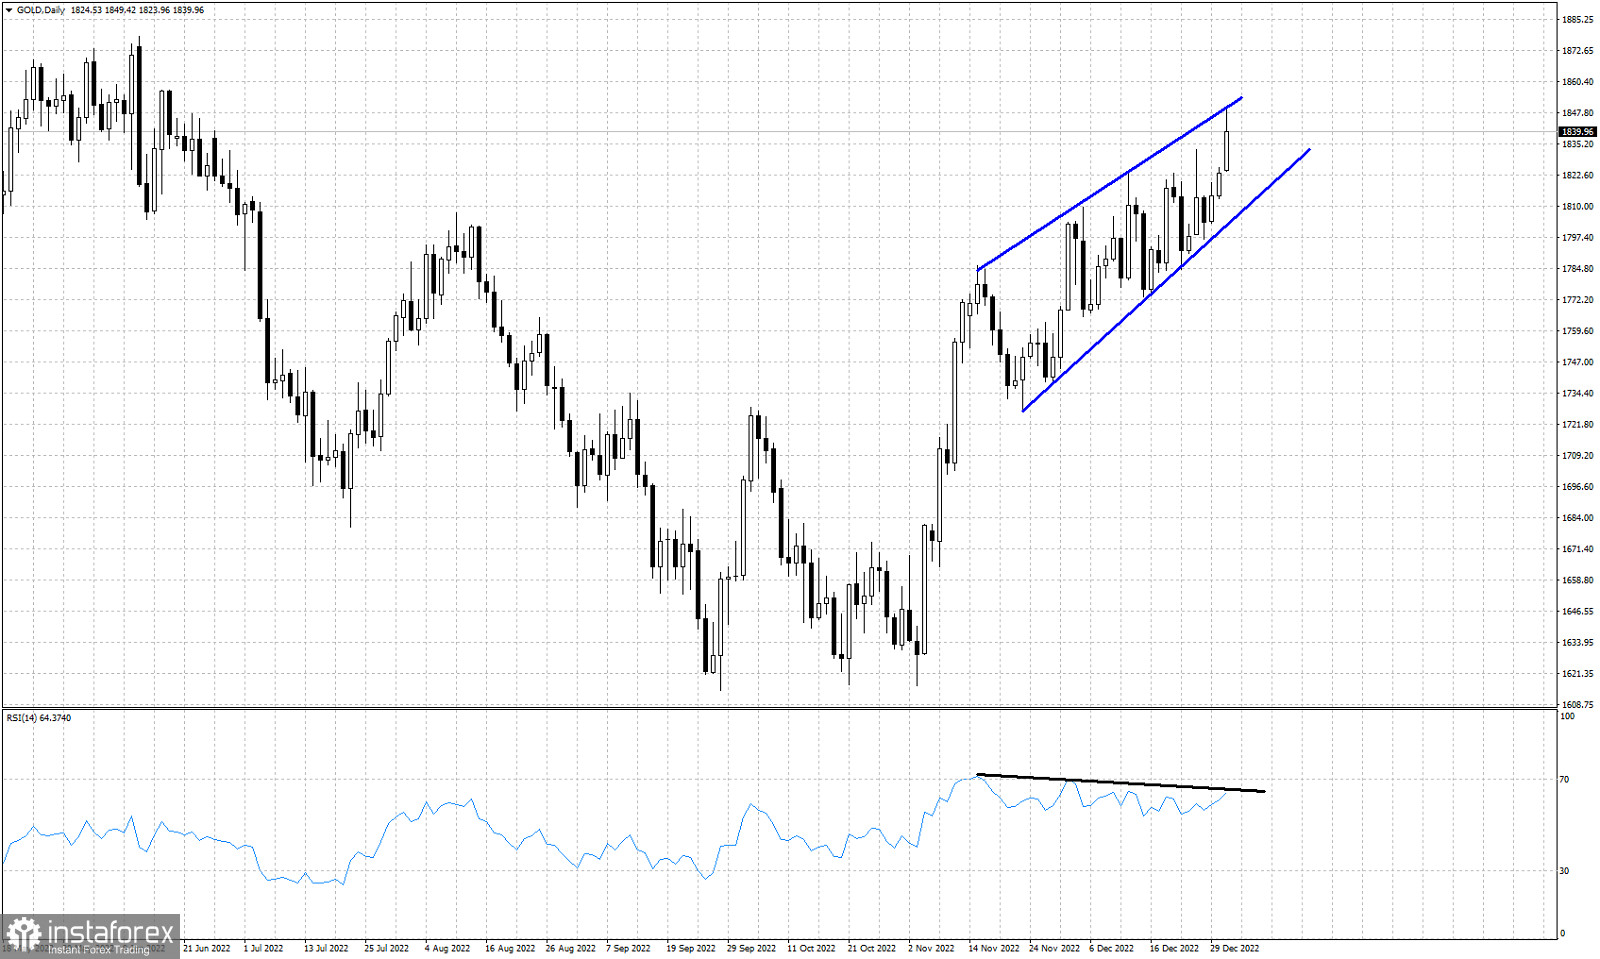
Black line- bearish divergence
Blue lines- wedge pattern
Gold price is trading above $1,830 and as expected by our last analysis, price made a high at $1,849 so far. Our expectation was to see a new higher high between $1,835-45. The RSI again did not make a new higher high instead it provided a lower high, thus a bearish divergence. The wedge pattern is a bearish formation. Combined with the bearish divergence we get increased chances of a reversal. At current levels we prefer to be neutral Gold expecting to get a reversal signal soon. Support is key at $1,800 and a break below it would be such a reversal signal. The bearish divergence suggests that the up trend continues to weaken. However we have still not a confirmed reversal signal. The bearish divergence is only a warning.


