


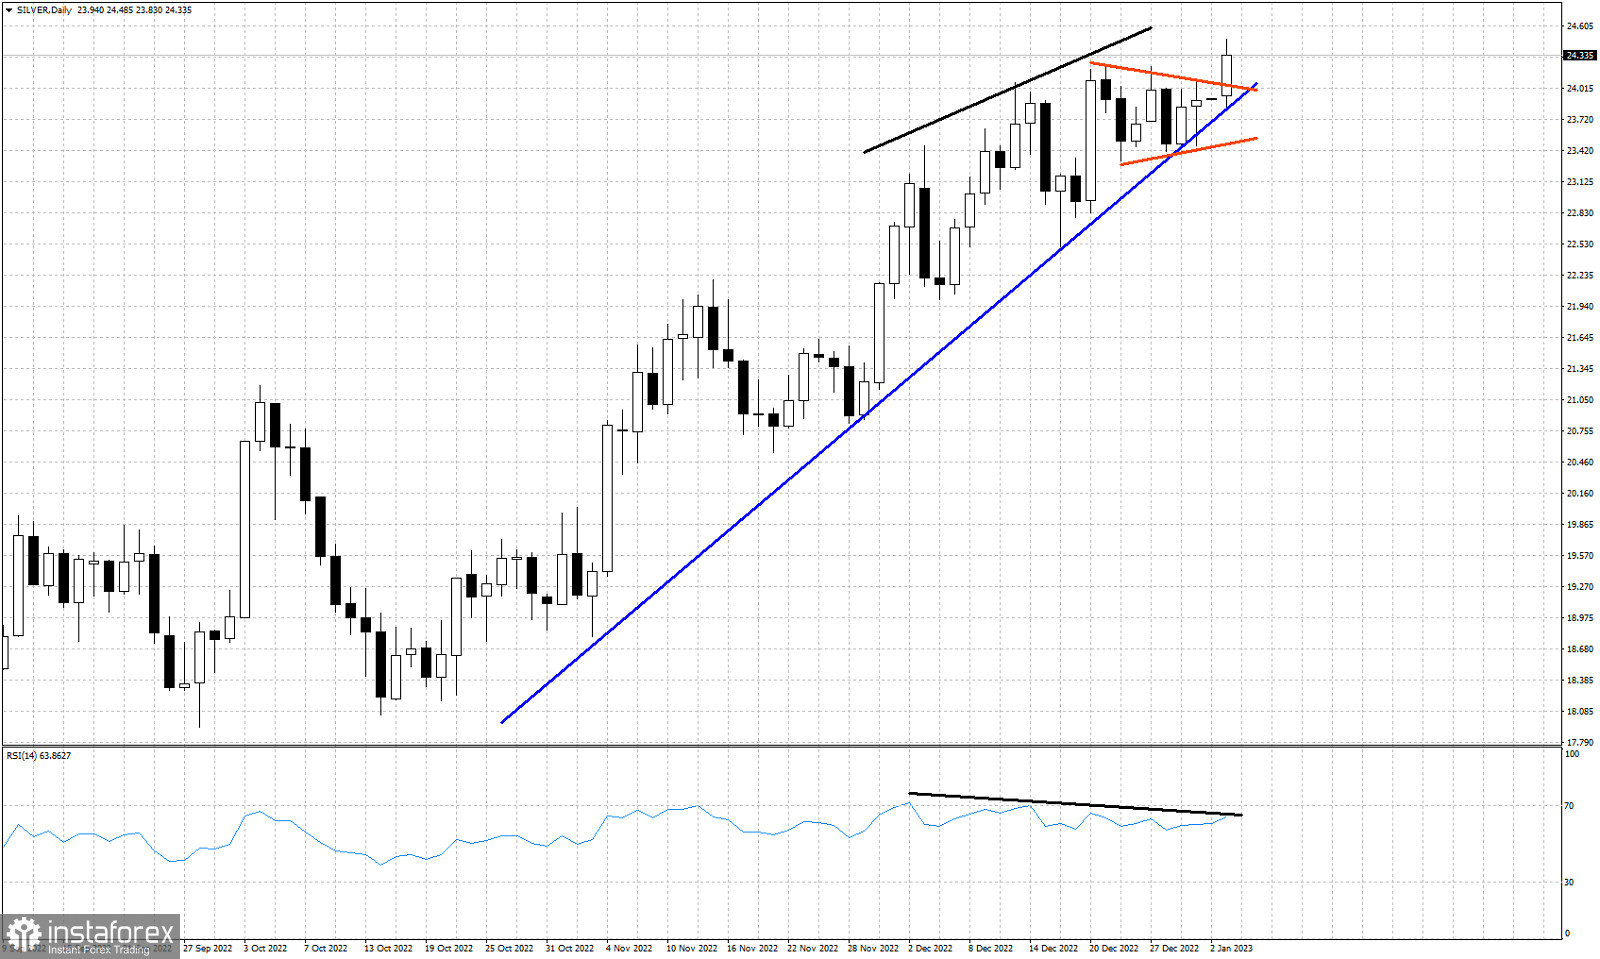
Blue line- support trend line
Black lines- bearish divergence
Red lines- triangle pattern
In our previous analysis on Silver we noted the triangle pattern we were in and noted that a break above $24.10 would be a bullish breakout with $25 as the target. So far price has risen as high as $24.48. Short-term trend remains bullish. The RSI has provided another lower high, thus another bearish divergence. As we mentioned in our previous post, triangle patterns are usually found in the final stages of a trend. This is most probably the final upward wave. Support remains key at the blue trend line and as long as we trade above it, bulls remain in control. The RSI continues to provide warning signs that the up trend is weakening. There are increased chances that bulls will not be able to maintain these price levels. We remain patient waiting for a reversal signal, otherwise we prefer to be neutral.


