


Trend analysis (Fig. 1).
The market may move down from the level of 1.0904 (close of yesterday's daily candle) to the target of 1.0860, the 85.4% retracement level (red dotted line). After testing this level, the price may pull back up with the target of 1.0905, the 14.6% retracement level (blue dotted line). From this level, it is possible to continue moving up.
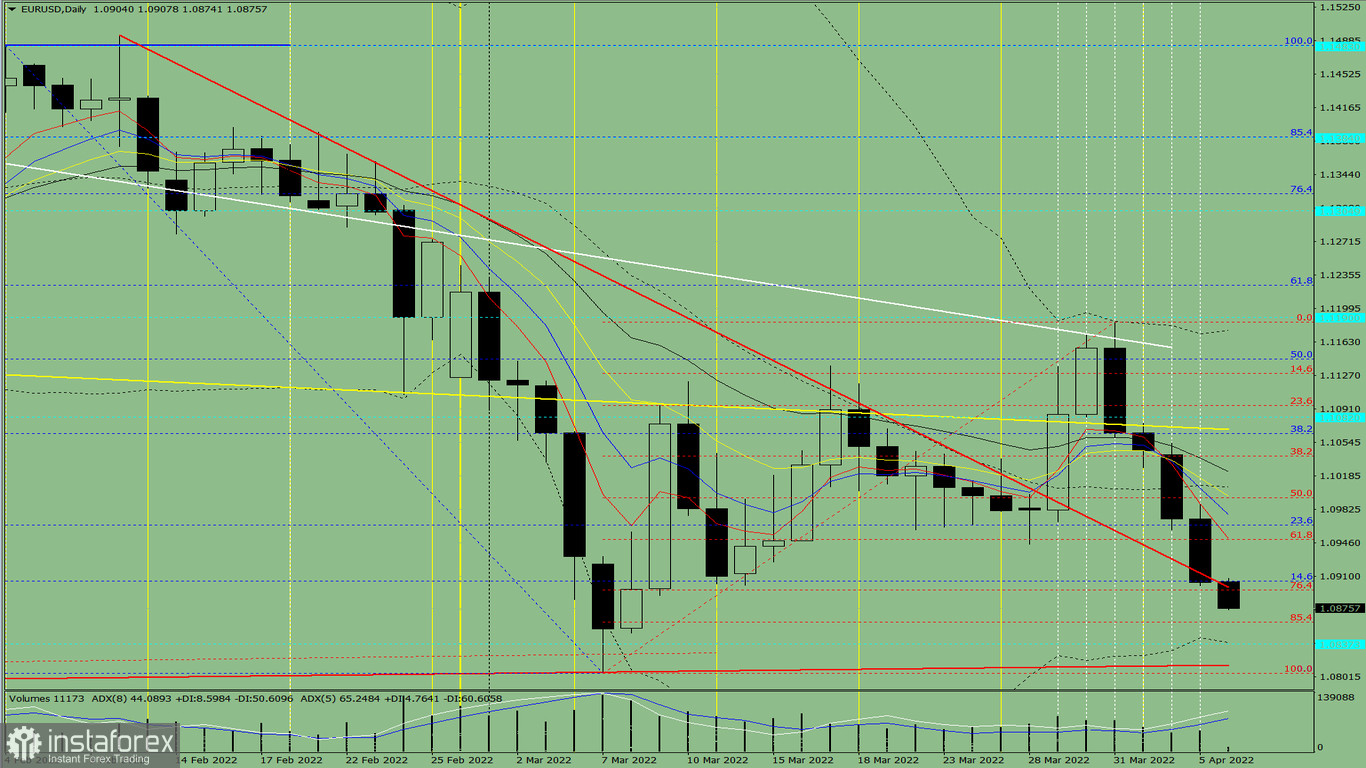
Fig. 1 (daily chart).
Comprehensive analysis:
- Indicator analysis - down;
- Fibonacci levels - down;
- Volumes - down;
- Candlestick analysis - down;
- Trend analysis - down;
- Bollinger bands - down;
- Weekly chart - down.
General conclusion:
The price may move downward from the level of 1.0904 (close of yesterday's daily candle) to the target of 1.0860, the 85.4% retracement level (red dotted line). After testing this level, the price may pull back up with the target of 1.0905, the 14.6% retracement level (blue dotted line). From this level, it is possible to continue moving up.
Alternative scenario: from the level of 1.0904 (close of yesterday's daily candle), the price may continue to move downward with the target of 1.0805, the lower fractal (red dotted line). After testing this level, the price may start moving upwards with the target of 1.0905, the 14.6% retracement level (thick red line).


