


EUR/USD 5M
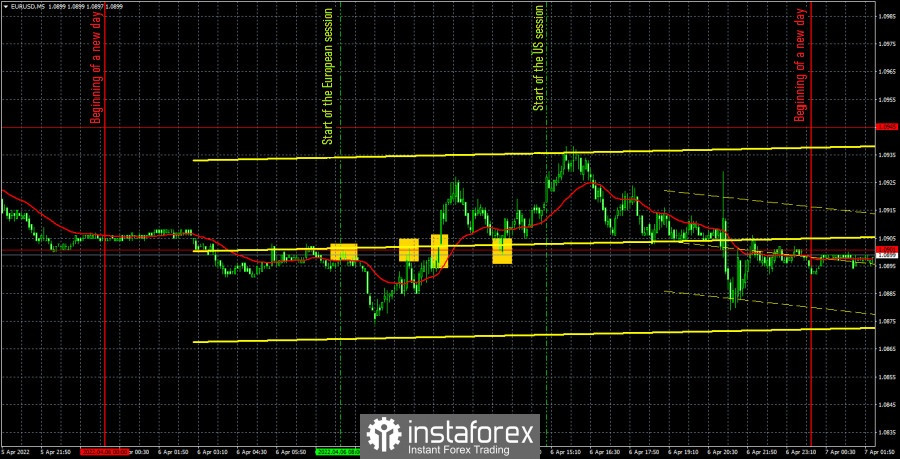
The EUR/USD pair did not show the movement that traders usually expect from it. For most of the day, there was a slight upward bias, which, however, was not provoked by any fundamental or macroeconomic data. Today, in principle, there were none in either the EU or the US. We already said in the last review that the Federal Reserve minutes is certainly interesting, but it was supposed to be published only late in the evening and could not have any effect on the movement during the day. Thus, traders took advantage of the temporary pause in order to take part of the profit on short positions, which led to a slight upward pullback of the pair. But this pullback practically does not change anything in the overall technical picture. The euro is still weak and still has no support from any factor. Almost everything that is now available in the information space indicates that the dollar will continue to rise. Of course, sooner or later this growth will also end, but it may still be very far from its end, given the weakness of the European Central Bank's position and the geopolitical background.
There were only four trading signals during the past day, and all of them were formed near the level of 1.0901. The movement during the day cannot be called flat, but it is also difficult to call it a trend. Traders could only work out the first two sell signals. Both turned out to be false. Not even because the price could not fall to the nearest level (it was very far away), but because the pair in both cases went down no more than 20 points. The first short position closed at a Stop Loss at breakeven, the second – with a minimal loss.
COT report:
The latest, Commitment of Traders (COT) report turned out to be as neutral as possible and did not show any serious changes in the mood of professional traders. The non-commercial group closed about 7,000 contracts long positions and 4,500 short positions during the reporting week. The net position of this group decreased by 2,500. At the same time, the total number of long positions still exceeds the total number of short positions of major players. That is, their mood is still bullish, although the euro has been falling for 14-15 months. Earlier, we have already drawn attention to the fact that in January and February, major players increased longs on the euro currency. In theory, this should have led to the growth of the currency itself. However, the euro did not show anything other than the usual slight correction. Since it was in January-February, when the geopolitical situation in the world and in Europe began to deteriorate sharply, we assume that at that time the demand for the US dollar was growing very much. That is why there was an increase in the euro/dollar pair, despite the fact that the demand for euros among market participants was also growing. The demand for the dollar just grew faster and stronger. Now the factor of geopolitics remains in force, therefore, with the bullish mood of the major players, it is quite possible to expect a new fall in the European currency. To some extent, this is a paradox, but a paradox explained by the current circumstances that have developed in the world.
We recommend to familiarize yourself with:
Overview of the EUR/USD pair. April 7. New EU sanctions are pushing the EU even closer to recession and energy crisis.
Overview of the GBP/USD pair. April 7. The Fed is ready to tighten monetary policy even faster and harder than expected.
Forecast and trading signals for GBP/USD on April 7. Detailed analysis of the movement of the pair and trading transactions.
EUR/USD 1H
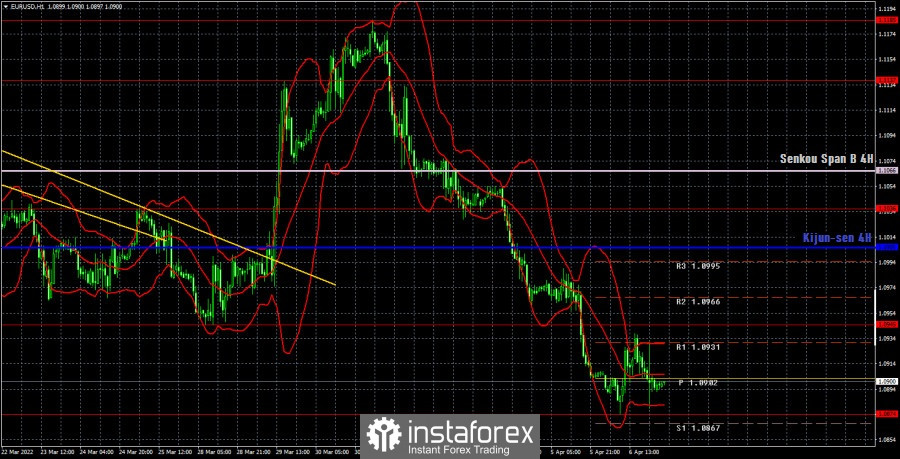
It is clearly visible that the downward movement continues on the hourly timeframe, but even a trend line cannot be formed on it now, since the fall is almost non-stop. If we form a trend line now, then the first tangible correction will lead to the price consolidating above it. And this may be false. However, the euro remains extremely weak in opposition to the dollar due to geopolitics and macroeconomics and is likely to continue its decline even without a trend line. We allocate the following levels for trading on Thursday – 1.0806, 1.0874, 1.0945, 1.1036, as well as the Senkou Span B (1.1066) and Kijun-sen (1.1005) lines. The lines of the Ichimoku indicator can move during the day, which should be taken into account when determining trading signals. There are also support and resistance levels, but no signals will be formed near them. Signals can be "bounces" and "breakthrough" levels - extremes and lines. Do not forget about placing a Stop Loss order at breakeven if the price went in the right direction of 15 points. This will protect you against possible losses if the signal turns out to be false. The European Union is scheduled to publish a report on retail sales on April 7, which has very little chance of causing a market reaction. In the United States, there is a speech by Finance Minister Janet Yellen, which attracts attention only with its loud sign, as well as the publication of absolutely secondary macroeconomic reports.
Explanations for the chart:
Support and Resistance Levels are the levels that serve as targets when buying or selling the pair. You can place Take Profit near these levels.
Kijun-sen and Senkou Span B lines are lines of the Ichimoku indicator transferred to the hourly timeframe from the 4-hour one.
Support and resistance areas are areas from which the price has repeatedly rebounded off.
Yellow lines are trend lines, trend channels and any other technical patterns.
Indicator 1 on the COT charts is the size of the net position of each category of traders.
Indicator 2 on the COT charts is the size of the net position for the non-commercial group.


