


GBP/USD 5M
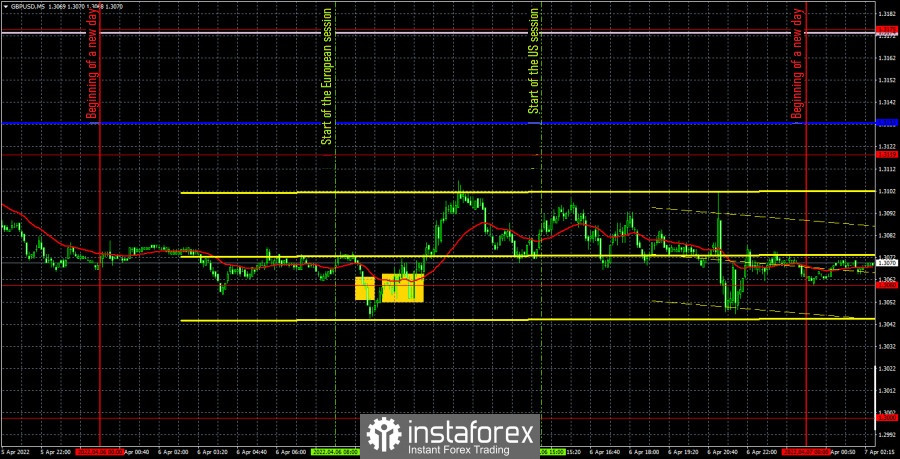
The GBP/USD currency pair started the European session very cheerfully, with an increase of 60 points. However, in the afternoon it became clear that the bulls' fuse dried up very quickly. And, most likely, it was not even a bulls' fuse, but a banal profit-taking by bears, which allowed the pound to adjust slightly. The general trend for the pound has not changed completely, and it is still downward. The geopolitical background has not changed over the past few days, despite the fact that Russian troops have left the Kiev, Sumy and Chernihiv regions. The military conflict is still ongoing and most international experts believe that in the next few days a new Russian offensive on Ukraine will begin. This is an absolutely logical continuation of the conflict, since it is unlikely that Moscow will simply withdraw its army from the territory of Ukraine after it has collected all kinds of sanctions from the whole world. Therefore, the pound and the euro will continue to remain in the "risk zone". In Britain, the index of business activity in the construction sector was published yesterday, which did not change by one tenth of a point in March compared to February. Naturally, there was no reaction to this report.
There were few trading signals on Wednesday, only two. At first, the pair settled below the extreme level of 1.3060. This sell signal turned out to be false as the fall did not continue. The next buy signal near the same level of 1.3060 turned out to be more convincing and could bring traders a couple of dozen points of profit, which offset the loss on the first transaction. But in general, the volatility of the pound/dollar pair was weak yesterday, and the movement was not trending. Therefore, it was extremely difficult to count on good signals and high profits.
COT report:
The latest Commitment of Traders (COT) report on the British pound showed minimal changes in the mood of major players. For a whole week, the non-commercial group opened only 700 short positions and closed 2,100 long positions. Thus, the net position of non-commercial traders decreased by 3,000. Even for the pound, such changes are insignificant. In general, the non-commercial group has almost 2.5 times more contracts for short positions than for longs. This means that the mood of professional traders is now "very bearish". Thus, this is another factor that speaks in favor of the continuation of the fall of the British currency. The situation with COT reports for the pound is completely different than for the euro. According to the pound, the mood of the major players changes every couple of months, and sometimes even faster. At this time, the "non-commercial" net position has already fallen to the levels where the last round of the pound's fall ended (the green line on the first indicator). Thus, we can even assume that in the coming weeks the pound will try to start a new ascent. However, much will again depend on geopolitics and technique. At the moment, the pound has a little more reason to grow than the euro. But there are plenty of factors of the fall.
We recommend to familiarize yourself with:
Overview of the EUR/USD pair. April 7. New EU sanctions are pushing the EU even closer to recession and energy crisis.
Overview of the GBP/USD pair. April 7. The Fed is ready to tighten monetary policy even faster and harder than expected.
Forecast and trading signals for EUR/USD on April 7. Detailed analysis of the movement of the pair and trading transactions.
GBP/USD 1H
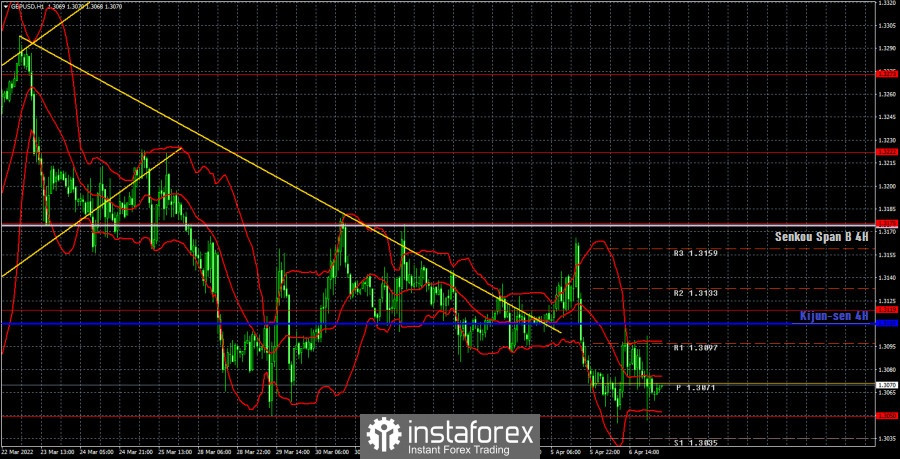
It is clearly visible on the hourly timeframe that the pair has not been able to determine the direction of movement for several weeks and continues to be near its 15-month lows. Yesterday, it reached the 1.3050 level, which is the previous local low. We believe that this level will fall in the near future, and the pound will continue to decline. The macroeconomic background is very weak this week, so geopolitics may become the catalyst for a new fall in the British currency. We highlight the following important levels on April 7: 1.3000, 1.3050, 1.3119, 1.3175, 1.3222. The Senkou Span B (1.3174) and Kijun-sen (1.3110) lines can also be signal sources. Signals can be "bounces" and "breakthroughs" of these levels and lines. It is recommended to set the Stop Loss level to breakeven when the price passes in the right direction by 20 points. The lines of the Ichimoku indicator can move during the day, which should be taken into account when determining trading signals. There are also support and resistance levels on the chart that can be used to take profits on transactions. There are no important reports or events scheduled in Great Britain for Thursday. There are only secondary reports in America. There will also be speeches by several representatives of the Federal Reserve monetary committee, and in case they show hawkish rhetoric, the dollar may also receive additional market support, as it occurred after Lael Brainard's speech on Tuesday.
Explanations for the chart:
Support and Resistance Levels are the levels that serve as targets when buying or selling the pair. You can place Take Profit near these levels.
Kijun-sen and Senkou Span B lines are lines of the Ichimoku indicator transferred to the hourly timeframe from the 4-hour one.
Support and resistance areas are areas from which the price has repeatedly rebounded off.
Yellow lines are trend lines, trend channels and any other technical patterns.
Indicator 1 on the COT charts is the size of the net position of each category of traders.
Indicator 2 on the COT charts is the size of the net position for the non-commercial group.


