


In my forecast this morning, I drew your attention to the level of 1.3034 and recommended entering the market from it. Let's have a look at the 5-minute chart and analyze where and how we could make some profit. Mixed data on the UK economy caused the pound to fall in the afternoon, though the unemployment rate declined. Let's try to figure out why it is so. Ahead of the report on the labor market, the pair rose to 1.3034 and formed a false breakout and a signal to open short positions, which then resulted in the sell-off of the pound by more than 40 pips. But the pair didn't make it to support of 1.2990. Technically, there were no changes in the second half of the day, just as there were no changes in the trading plan.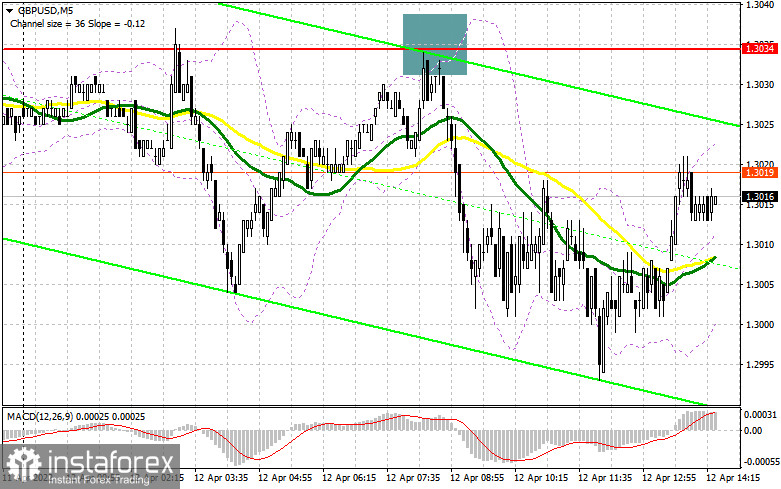
Long positions on GBP/USD:
The pound fell after jobless claims showed a drop and the unemployment rate plummeted to 3.8%. This was due to the data on the change in average earnings in the UK. According to the data, average earnings in the UK, excluding bonuses, rose only by 4.1% on a yearly basis. However, when adjusted for inflation, average earnings fell by 1.3% over the same period, which is a very weak reading. This is the reason why the pound plummeted sharply against the US dollar. During the US session, traders are waiting for an important report on inflation in the United States. The US consumer price index is expected to rise to 8.5% in March this year, against 7.9% in February. If the data exceeds economists' forecasts, it will definitely reflect negatively on GBP, which may continue its downtrend against USD. As I mentioned above, the technical picture of the pound has not changed in the afternoon. If the pair falls after the US data is released, only a false breakout at 1.2990 is likely to create a buy signal, which will return GBP/USD to the resistance area at 1.3034. However, we are all aware of the conditions that the pound is in, and bears are likely to respond with strong activity to every pound's rally. A breakthrough and a test of 1.3034 can form an additional entry point to long positions, which will possibly increase demand for the pound and send it to the high of 1.3071. The next target is located at 1.3104, where traders may take profits. However, the pair will be able to touch this level only with very positive news about the conflict between Russia and Ukraine. If the pound falls during the US session and there is a lack of activity at 1.2990, it is better to postpone opening longs until the pair reaches the next low at 1.2950. Only the formation of a false breakout at this level can cancel the bearish trend and give an entry point counting on a short-term upward bounce of the pair. You can also open long positions on the GBP/USD pair on a rebound from 1.2911, or lower near 1.2856, allowing an intraday correction of 30-35 pips.
Short positions on GBP/USD:
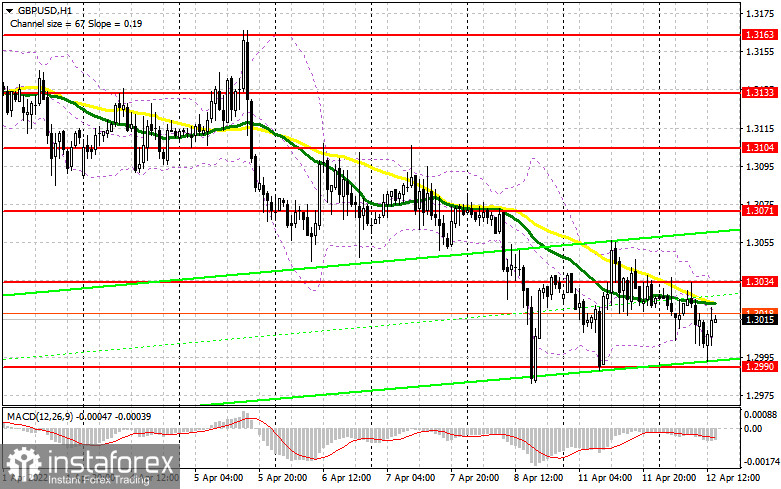
Bears need to take advantage of the situation, but only a larger rise in inflation in the United States, above economists' forecasts, may help them to break through the monthly lows. The sellers' first priority is to hold the price below 1.3034. The moving averages are located near this level. Currently, the MAs are playing on the bears' side. A false breakout at this level is likely to open an entry point into short positions with bearish momentum to continue and the pair pushed down to yesterday's support of 1.2990. There are a lot of speculative buyers' stop-loss orders at this level. A breakthrough and a reverse bottom/top test of 1.2990 may send the GBP/USD pair to the lows of 1.2950 and 1.2911. The next target is at 1.2856, where traders may generate profit. If the pair grows during the US session and bears are not so active at 1.3034, it is better to postpone opening shorts until the pair reaches 1.3071. I also recommend opening short positions there only in the case of a false breakout. Selling the pair immediately on the rebound is possible from the high of 1.3104, counting on an intraday bounce down by 30-35 pips.
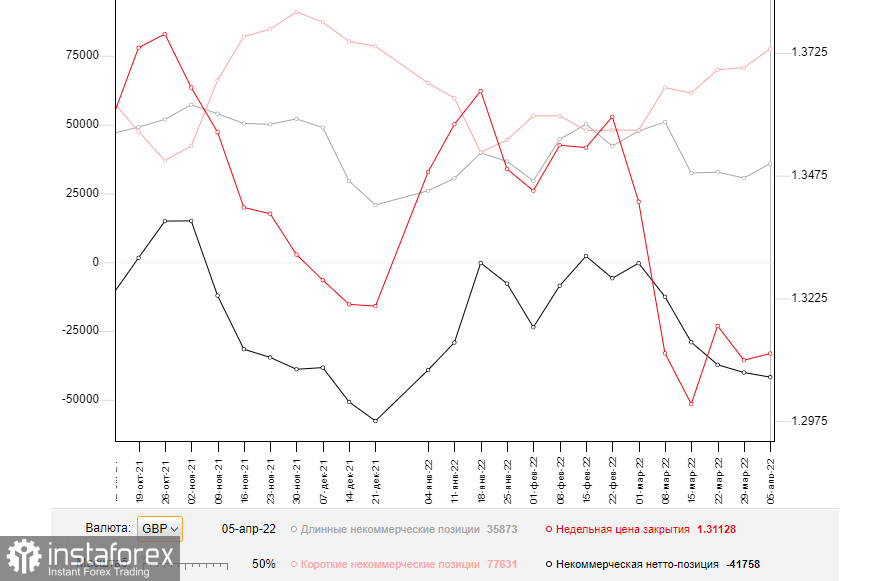
The COT (Commitment of Traders) report for April 5 logged an increase in both short and long positions. However, the long ones prevailed in number, which once again led to the growth of the negative delta. Concerns about the UK economy and the risks of higher inflation, which are likely to hurt the British households financially, were confirmed. Recent GDP data indicated a very sharp slowdown in the economy. Experts note that the situation will only get worse, as inflation risks are now quite difficult to assess, but it is certain that the consumer price index will continue to rise in the coming months. At the same time, the soft stance of the Governor of the Bank of England only pushes prices up. Bulls can only count on the positive results of the negotiations between Russia and Ukraine and the progress towards the settlement of the conflict. The aggressive policy of the Federal Reserve System, which is becoming more hawkish every day, cannot be ruled out. The US does not have the same economic problems as the UK, so the Fed can raise rates more aggressively, which it is going to do during the May meeting. It is another signal to sell the pound against the US dollar. The April 5 COT report showed that long non-commercial positions rose to 35,873 from 30,624, while short non-commercials jumped to 77,631 from 70,694. This led to an increase in the negative nonprofit net position to -41,758 from -40,070. The weekly closing price rose to 1.3112 from 1.3099.
Signals of indicators:
Moving averages
Trading is conducted around 30- and 50- daily moving averages, which indicates a confrontation between buyers and sellers.
Note. The period and prices of moving averages are considered by the author on the hourly chart H1 and differ from the general definition of the classic daily moving averages on the daily chart D1.
Bollinger Bands
In the case of a decline, the lower boundary of the indicator around 1.3010 will act as support.
Description of indicators
- Moving average determines the current trend by smoothing out volatility and noise. Period 50. The graph is marked in yellow.
- Moving average determines the current trend by smoothing out volatility and noise. Period 30. The graph is marked in green.
- MACD indicator (Moving Average Convergence / Divergence) Fast EMA period 12. Slow EMA period 26. SMA period 9
- Bollinger Bands (Bollinger Bands). Period 20
- Non-profit speculative traders, such as individual traders, hedge funds, and large institutions use the futures market for speculative purposes and to meet certain requirements.
- Long non-commercial positions represent the total long open position of non-commercial traders.
- Short non-commercial positions represent the total short open position of non-commercial traders.
- Total non-commercial net position is the difference between the short and long positions of non-commercial traders.


