


Trend analysis (Fig. 1).
On Thursday, the pair is likely to go up from 1.3112 (closing level of yesterday's daily candlestick) to the 1.3139 target, in line with the 50.0% retracement level (red dotted line). Should the quote test the mark, the pair would head towards the 1.3177 target, in line with the 61.8% retracement level (red dotted line), test it, and go down.
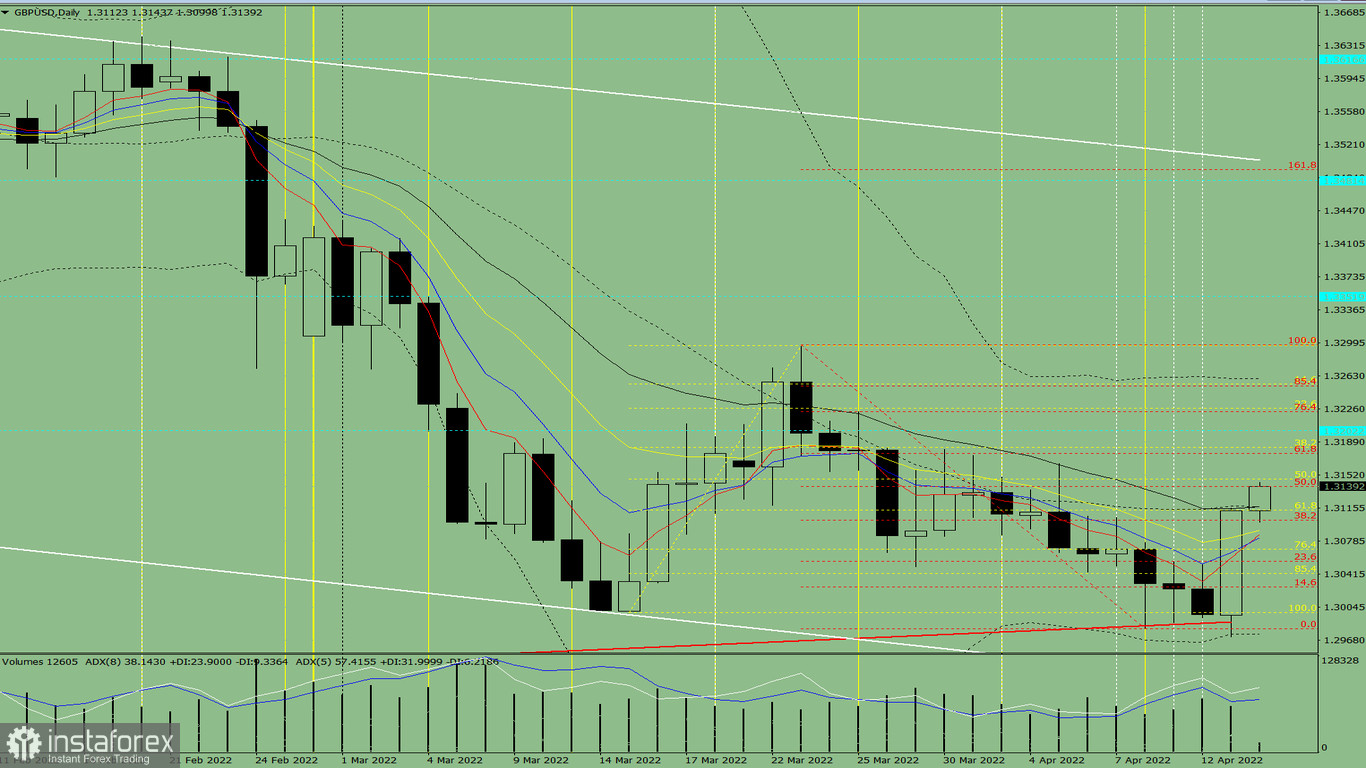
Fig. 1 (daily chart).
Comprehensive analysis:
- indicator analysis - up
- Fibonacci analysis - up
- volume analysis - up
- candlestick analysis - up
- trend analysis - up
- Bollinger bands analysis - up
- weekly chart analysis - up
Final thoughts:
Today, the pair is likely to go up from 1.3112 (closing level of yesterday's daily candlestick) to the 1.3139 target, in line with the 50.0% retracement level (red dotted line). Should the quote test the mark, the pair would head towards the 1.3177 target, in line with the 61.8% retracement level (red dotted line), test it, and go down.
Alternative scenario: the pair may rise from 1.3112 (closing level of yesterday's daily candlestick) to the 1.3139 target, in line with the 50.0% retracement level (red dotted line). Having tested the mark, the quote may go down to the 1.3069 target, in line with the 76.4% retracement level, test it, reverse up.


