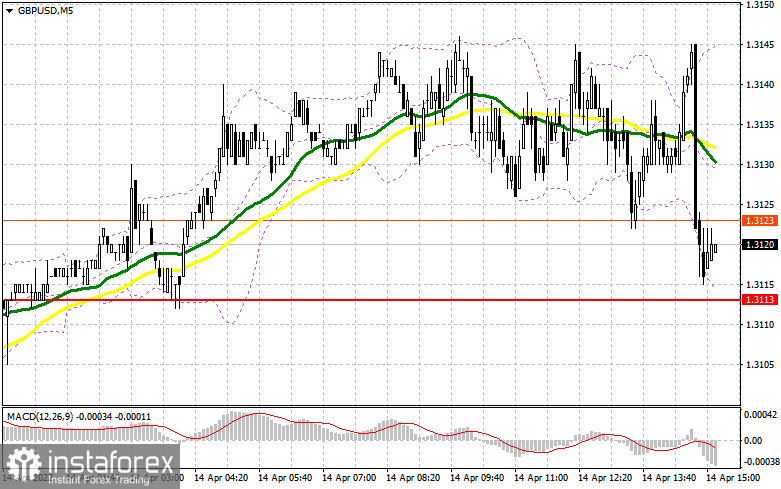
Low volatility (about 25 points in the first half of the day) confirmed the theory that no one is interested in the British pound at current highs. In my morning forecast, I paid attention to the level of 1.3113 and recommended making decisions on entering the market. Let's look at the 5-minute chart and figure out where and how you could earn. The pair's decline to this range took place in the first half of the day, but it did not work out to wait for the formation of a false breakdown at this level. From a technical point of view, nothing has changed, although it is worth paying attention to the new resistance of 1.3143, which we will talk about below. And what were the entry points for the euro this morning?

To open long positions on GBP/USD, you need:
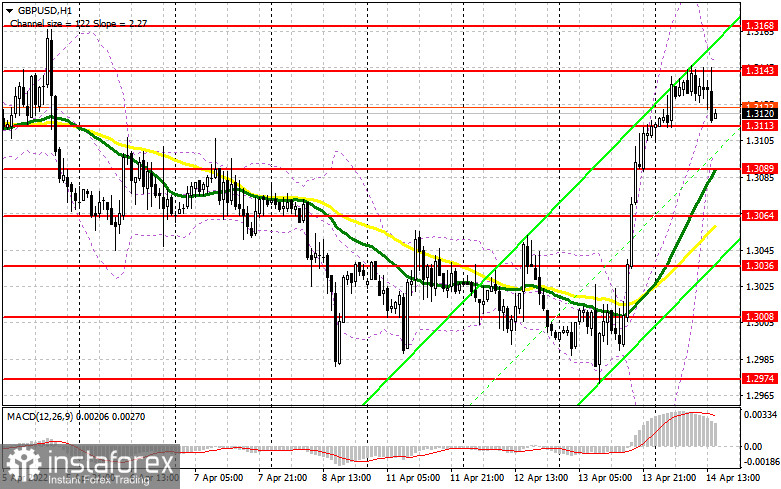
The lack of statistics on the UK did not support the bull market formed yesterday amid rumors that the Bank of England, after receiving inflation data, may begin to pursue a more aggressive monetary policy. But the rumors remained rumors, which cooled the ardor of buyers a little. If you look at it this way, the primary task of the bulls remains to protect the nearest support of 1.3113, which was formed following the results of yesterday. Of course, it will not be entirely true to count on instant purchases from this level, since strong data on the American economy can significantly harm buyers' plans. Reports on retail sales and the US labor market are expected, and strong data will certainly strengthen the position of the US dollar, as everything will indicate a further increase in inflation. For this reason, I recommend opening long positions from 1.3113 only after a false breakdown. But for further growth, bulls need to rely on something, since it will not be easy to get above the nearest resistance of 1.3143. The breakdown and the test of 1.3143 from top to bottom form an additional entry point for opening long positions, which will strengthen the bulls and open the way to the area of 1.3168. The longer-range target will be the maximum of 1.3195, where I recommend fixing the profits. If the pound declines and there are no buyers at 1.3113, there is no need to panic. It is best to postpone purchases until the next support at 1.3089, where the moving averages are playing on the buyers' side. I advise you to enter the market there only if there is a false breakdown. You can buy GBP/USD immediately for a rebound from 1.3064, or even lower - in the area of 1.3036 and only for a correction of 30-35 points within a day.
To open short positions on GBP/USD, you need:
A small correction of the pound in the area of 1.3113 can hardly be recorded as an asset to buyers since major players do not show special initiative at current levels. The bears may be waiting for statistics on the United States, which will help determine the future direction. Of course, nobody wants to sell after yesterday's bull market. In addition to data on retail sales and the labor market, I advise you to pay attention to the consumer sentiment index and inflation expectations from the University of Michigan. The speech of FOMC member Loretta Mester and her hawkish view of the Fed's policy may push to buy the US dollar, which will increase pressure on the pair. The primary task of the bears remains to protect the support of 1.3143. The formation of a false breakdown at this level will be an excellent sell signal. You can also count on the breakdown of 1.3113. A breakout and a reverse test from the bottom up of this range will lead to the formation of a sell signal that can return the pound to the lows of 1.3089 and 1.3064, where the moving averages are already playing on the buyers' side. I recommend fixing profits there. In the scenario of GBP/USD growth and lack of activity around 1.3143, I advise you to postpone short positions to a larger resistance of 1.3168. I also advise you to open short positions there only in case of a false breakdown. It is possible to sell GBP/USD immediately for a rebound from the maximum of 1.3195, counting on the pair's rebound down by 30-35 points within a day.

The COT report (Commitment of Traders) for April 5 recorded an increase in both short and long positions. However, there were more of the first ones, which once again led to an increase in the negative delta. Concerns related to the state of the UK economy and the risks of high inflation, which is sure to further exacerbate the ongoing crisis of British households, have been confirmed. Recent GDP data indicated a very sharp slowdown in economic growth. Experts note that the situation will only worsen, as inflation risks are now quite difficult to assess, but it is clear for sure that the consumer price index will continue to grow in the coming months. At the same time, the soft position of the governor of the Bank of England will only push prices up. The only thing the bulls can count on now is the positive results of the negotiations between the representatives of Russia and Ukraine and progress towards a settlement of the conflict. Do not forget about the aggressive policy of the Federal Reserve System, which is becoming more hawkish every day. In the US, there are no such problems with the economy as in the UK, so there the Fed can raise rates more actively, which it is going to do during the May meeting - another signal towards selling the pound against the US dollar. The COT report for April 5 indicated that long non-commercial positions rose from the level of 30,624 to the level of 35,873, while short non-commercial positions jumped from the level of 70,694 to the level of 77,631. This led to an increase in the negative value of the non-commercial net position from -40 070 to -41 758. The weekly closing price rose to 1.3112 against 1.3099.
Signals of indicators:
Moving averages
Trading is conducted above 30 and 50 daily moving averages, which indicates an attempt by the bulls to continue the growth of the pair and break the bearish trend.
Note. The period and prices of moving averages are considered by the author on the hourly chart H1 and differ from the general definition of the classic daily moving averages on the daily chart D1.
Bollinger Bands
In case of a decline, the lower limit of the indicator around 1.3100 will act as support.
Description of indicators
- Moving average (moving average determines the current trend by smoothing out volatility and noise). Period 50. The graph is marked in yellow.
- Moving average (moving average determines the current trend by smoothing out volatility and noise). Period 30. The graph is marked in green.
- MACD indicator (Moving Average Convergence / Divergence - moving average convergence/divergence) Fast EMA period 12. Slow EMA period 26. SMA period 9
- Bollinger Bands (Bollinger Bands). Period 20
- Non-profit speculative traders, such as individual traders, hedge funds, and large institutions use the futures market for speculative purposes and to meet certain requirements.
- Long non-commercial positions represent the total long open position of non-commercial traders.
- Short non-commercial positions represent the total short open position of non-commercial traders.
- Total non-commercial net position is the difference between the short and long positions of non-commercial traders.


