


The euro dropped below 1.0890 again after the ECB rate announcement. However, we have a speech from European Central Bank President Christine Lagarde, and a lot depends on her statements. In my forecast this morning, I drew your attention to the level of 1.0885 and recommended entering the market from that level. Let's have a look at the 5-minute chart and analyze what happened. The breakthrough of the level mentioned above occurred without a reverse test bottom/top, so there were no signals to enter the market. From the technical point of view, there are small changes.
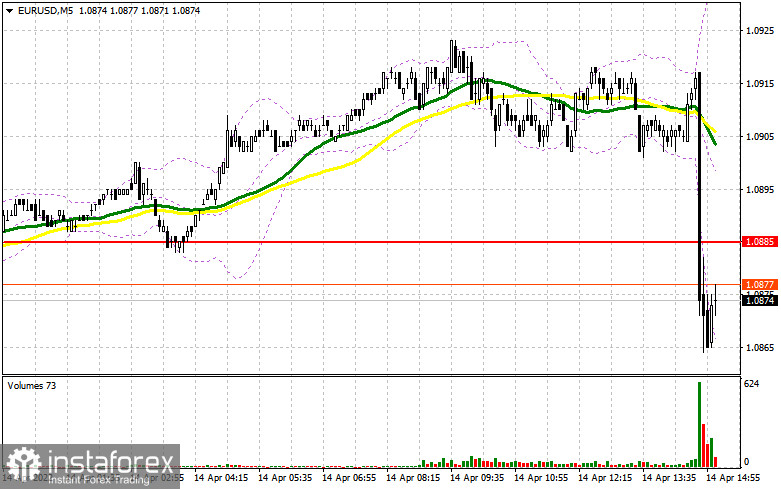
Long positions on EUR/USD:
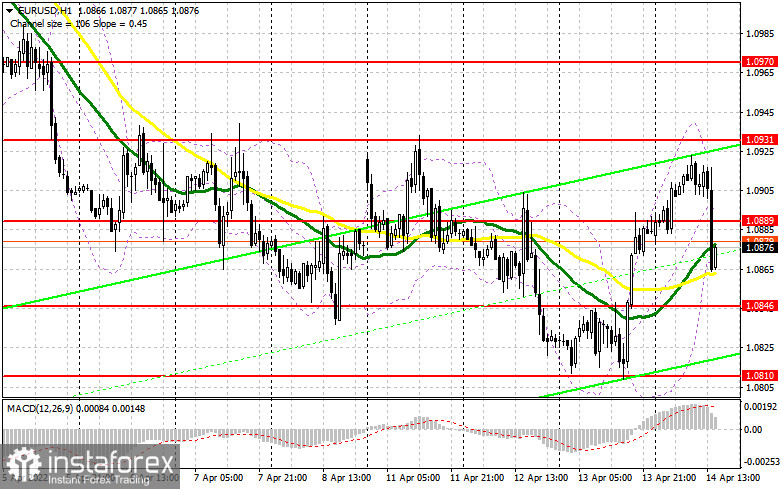
As I noted above, it is very important what Christine Lagarde will tell us today. The Governing Council is expected to refrain from major decisions at this meeting, and most likely they will be made at the June meeting, where new forecasts on the economy should give more data on the effects of the Russian special operation in Ukraine. This will allow the ECB to steer monetary policy more precisely. If Lagarde takes a more aggressive stance, hinting at the end of the asset purchase program in Q3 this year, euro buyers may get a good boost. If the EUR/USD pair returns and fixes at 1.0889, with a top/bottom retest, it may create a good buy signal aimed to continue yesterday's uptrend with the target of 1.0931, in an attempt to establish a new bullish trend. The level of 1.0931 is quite difficult to reach for bulls, but a more aggressive policy of the ECB is likely to help them to touch it. A breakthrough and a fixation at 1.0931 may give a buy signal for the euro, with the prospect of reaching the highs of 1.0970 and 1.1007, where traders may take profits. If the pair falls after the speech of Lagarde, bulls can only count on the support near 1.0845. Only a false breakout at this level is likely to form the first buy signal. If bulls show weak activity at 1.0846, the trading plan should be reconsidered. If so, it may be better to hold long positions open until the price reaches the monthly low at 1.0810. Opening of long positions on the pullback is possible from 1.0772 or the new low at 1.0728, allowing an intraday upward correction of 30-35 pips.
Short positions on EUR/USD:
Bears created a downward momentum in the pair. Most likely, they tried to trigger stop-loss orders of those who opened positions at lower levels expecting a rally in the euro after the ECB meeting. However, quite strong US statistics are to be released today. The change in the retail trade volume may influence the US dollar, and if the data exceed economists' expectations, the pressure on the euro may increase. Bears need to hold the price below the new resistance at 1.0889. With strong data on the US labor market and the University of Michigan Consumer Sentiment index, A false breakout at this level may bring back pressure on the pair and give a sell signal with the target at the support of 1.0846. The daily renewal of the local lows is also important for the bearish market, that's why a breakthrough and a reverse bottom/top test of 1.0846 can form a sell signal, which will open the way to the lows of 1.0810 and 1.0772, where traders may lock in profits. If the euro rises in the afternoon and bears are weak at 1.0889, bulls can regain control of the market. The euro is expected to show a sharper rally after the speech of ECB President Christine Lagarde. In this case, only the formation of a false breakout at 1.0931 is likely to create a sell signal for the euro. It is possible to sell immediately on a rebound from 1.0970, or higher near 1.1001, allowing a downward correction of 25-30 pips.
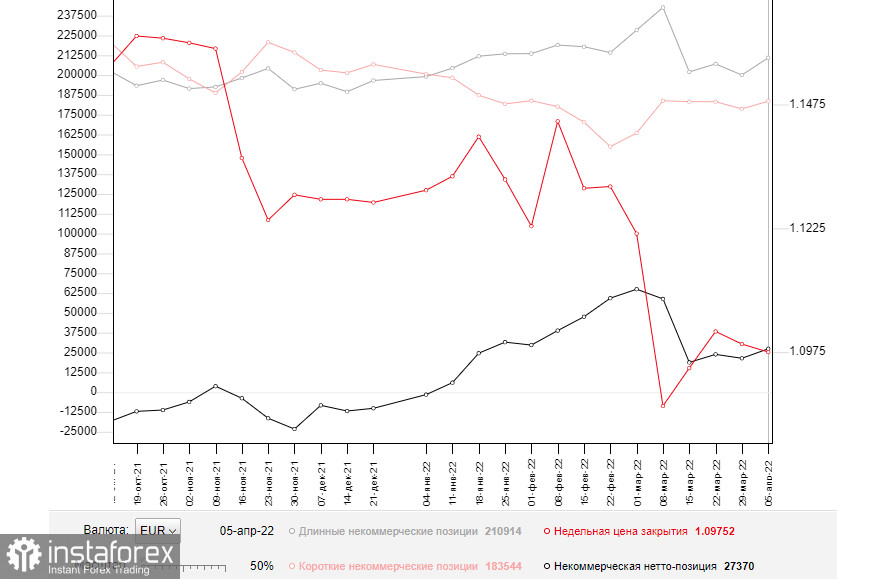
The COT (Commitment of Traders) report for April 5 logged an increase in both short and long positions. Notably, there were more buyers than sellers. All this was due to positive expectations of new measures from the European Central Bank, which has been recently talking a lot about the need for tighter monetary policy. However, the lack of positive news on Russia-Ukraine negotiations and growing geopolitical tensions continue to negatively affect the euro, which does not allow bulls to make an upward correction. The important data on inflation in the Eurozone and the US will be released soon. These reports contain more objective readings about the growth rate of prices after the start of the Russian military special operation. This will give investors and policymakers more guidance on how to proceed with monetary policy, which will partly decide the future direction of the EUR/USD pair. The COT report indicated that long non-commercial positions rose to 210,914 from 200,043, while short non-commercial positions increased to 183,544 from 178,669. Considering the growth in short positions was less impressive than in the long's one, the total non-commercial net positioning was up for the week, to 27,370 from 21,374. The weekly closing price fell to 1.0976 from 1.0991.
Indicators' signals:
Moving averages
Trading is around the 30- and 50- day moving averages, indicating an active confrontation between bulls and bears.
Note: Period and prices of moving averages are considered by the author on hourly chart H1 and differ from the general definition of classic daily moving averages on daily chart D1.
Bollinger Bands
In the case of the growth of the pair, the upper boundary of the indicator near 1.0930 will act as resistance. A breakthrough of the lower boundary of the indicator at 1.0850 will lead to a larger fall in the pair.
Indicators description
- Moving average defines the current trend by smoothing out volatility and noise. Period 50. Marked in yellow.
- Moving average defines the current trend by smoothing out volatility and noise. Period 30. Marked in green.
- MACD (Moving Average Convergence/Divergence) indicator Fast EMA of period 12. Slow EMA period 26. SMA period 9
- Bollinger Bands. Period 20
- Non-commercial traders are speculators, such as individual traders, hedge funds, and large institutions, which use the futures market for speculative purposes and meet certain requirements.
- Long non-commercial positions represent the total long open position of non-commercial traders.
- Short non-commercial positions represent the total short open position of non-commercial traders.
- The total non-commercial net position is the difference between short and long positions of non-commercial traders.


