


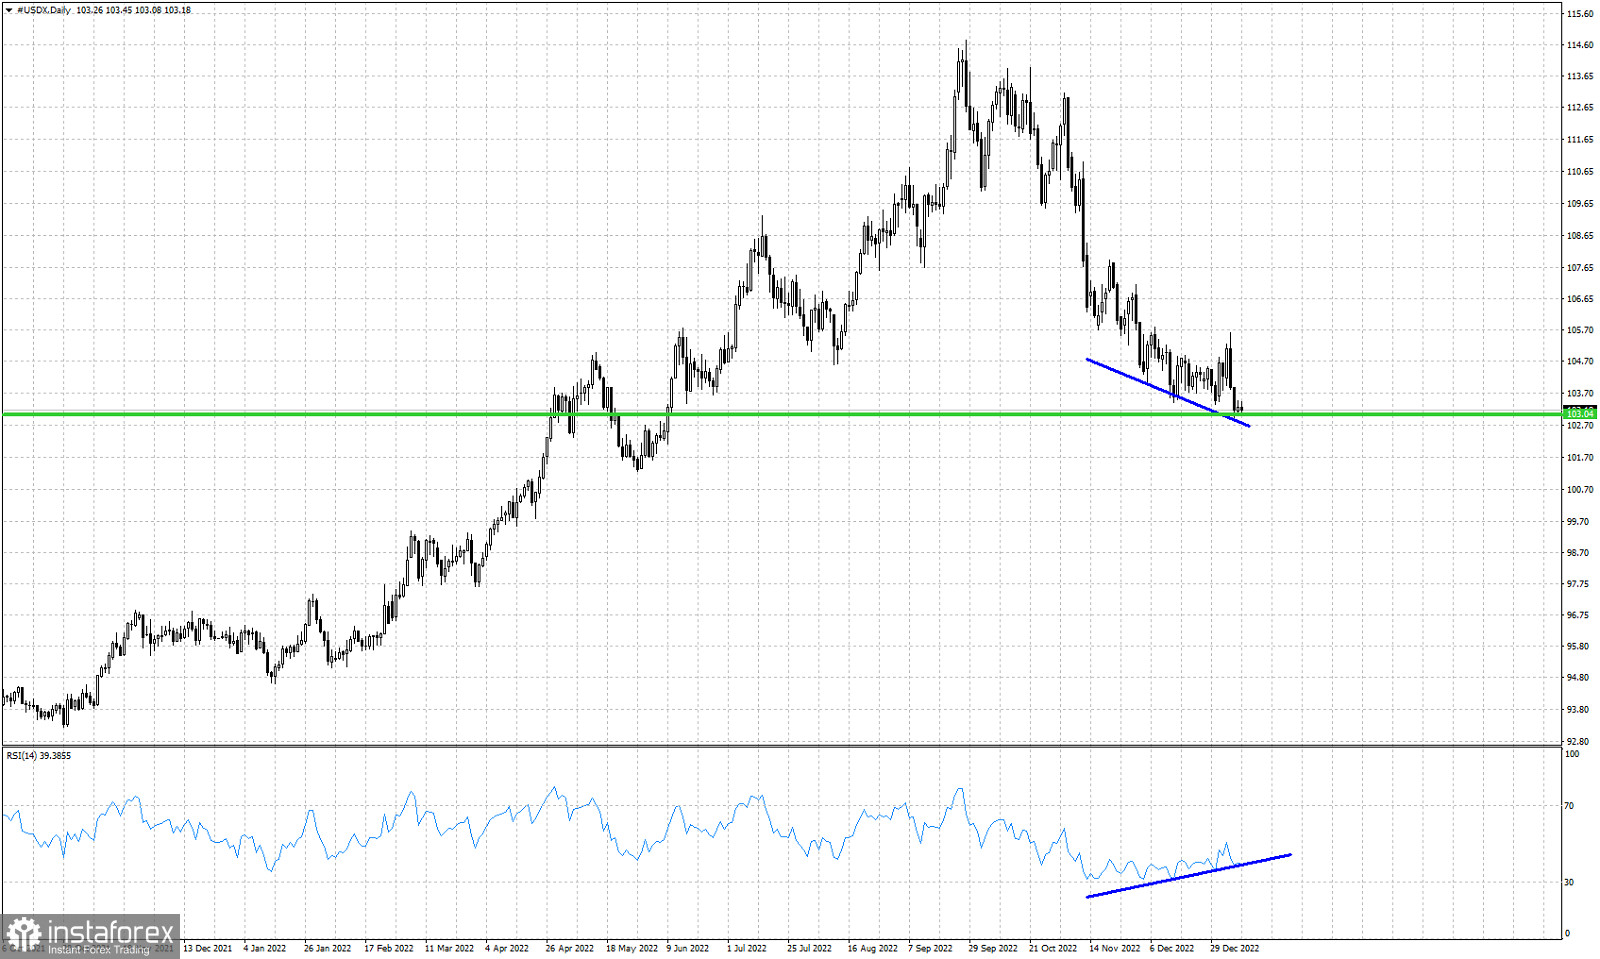
Blue lines- bullish RSI divergence
Green line- horizontal support
The Dollar index remains in a bearish trend making lower lows and lower highs. Price recently made a strong bounce fooling most people that the down trend was over and a bounce was coming. On the contrary bears stepped back in and pushed the index to new lows at 102.91. In the Daily chart we se price challenging the 103 level but with the RSI providing several higher lows so far, suggesting the downtrend is close to an end. However as we have said many times before, the divergence in the RSI is only a warning and not a reversal confirmation.
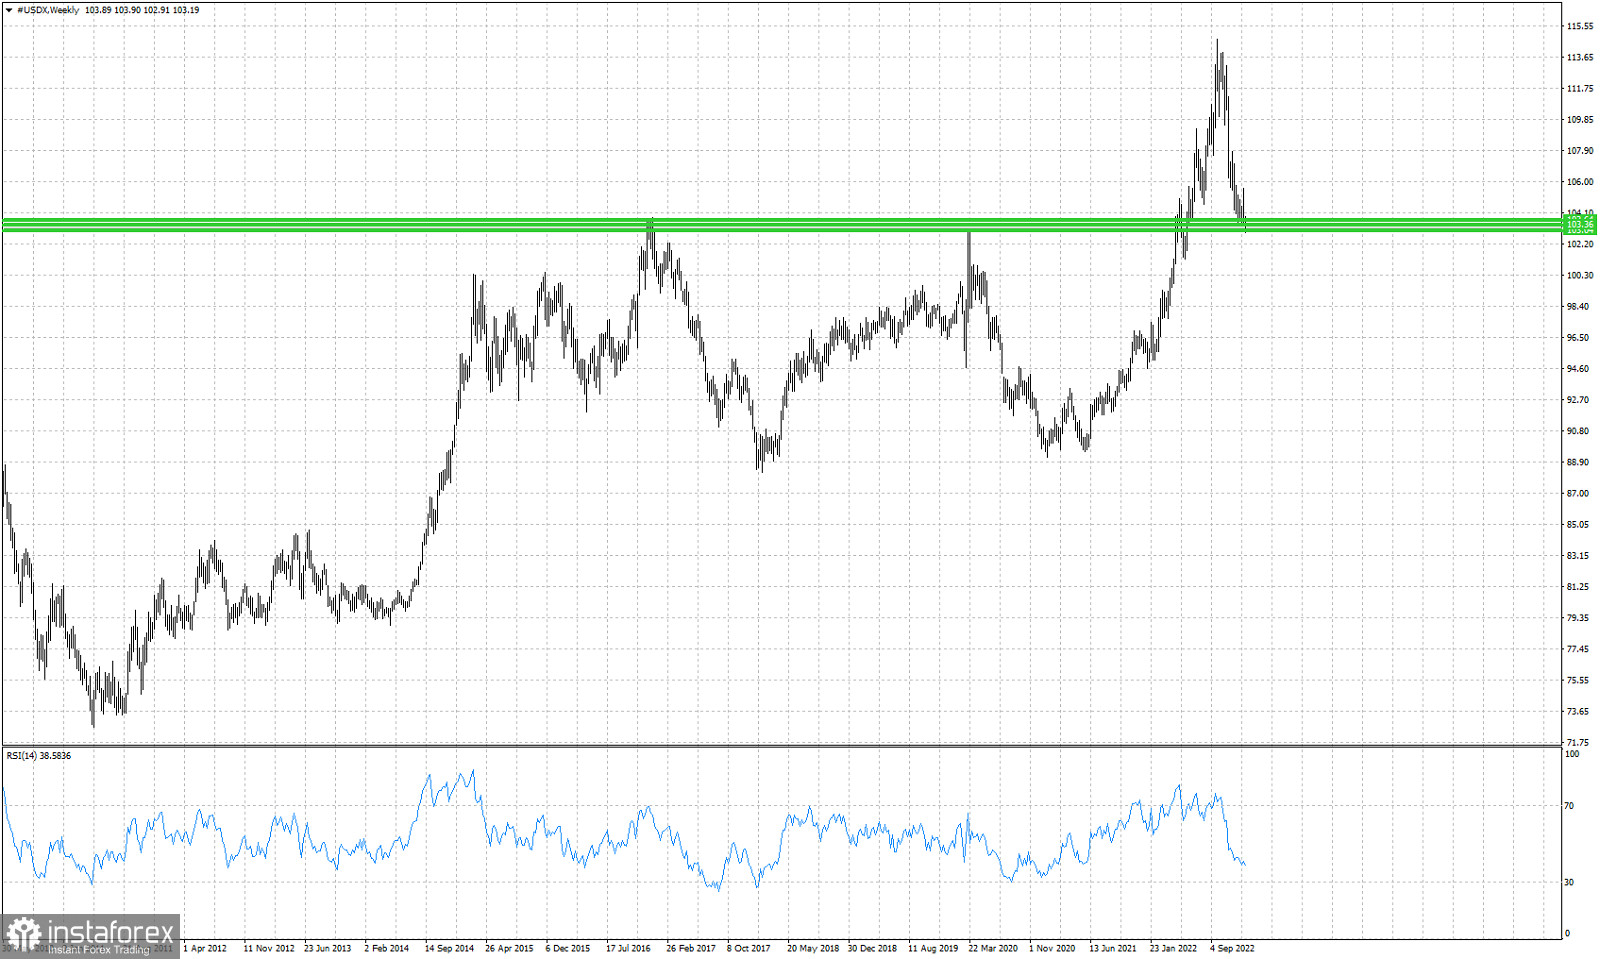
Green lines- support zone, previous resistance, now support
Zooming out on the chart we see that the Dollar index is now challenging what was once resistance and the a level where a double top was formed. In 2016 and in 2020 the Dollar index got rejected by the 103 level and declines towards 89-90 followed. We consider this as an important support level and given the short-term bullish divergence signs by the RSI, we believe there are many chances of a strong bounce. Traders need to be cautious. Opening new short positions at current levels is considered very risky.


