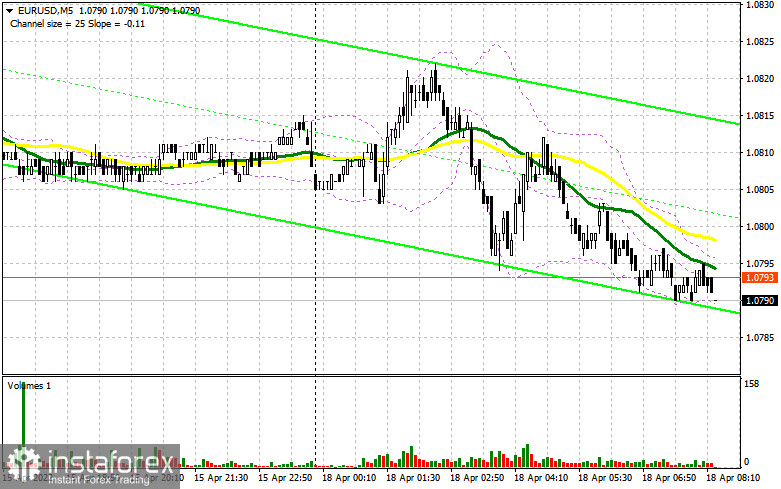
On Friday, traders did not receive any signals to enter the market since before Easter, volatility and trade volume were rather low. Let us take a look at the 5-minute chart to clear up the situation. The fact is that the pair did not hit any of the expected levels. That is why traders did not get any convenient points to enter the market. Today, the situation is likely to be the same, as trade volume could be very low due to the ongoing weekend in some countries.

Conditions for opening long positions on EUR/USD:
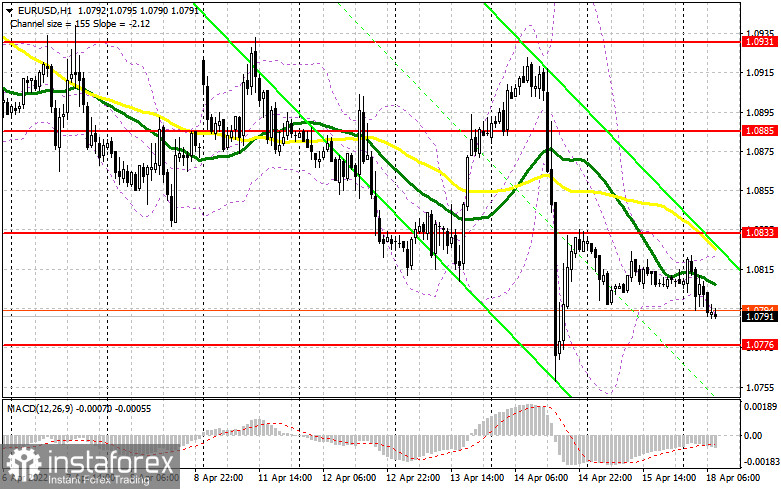
In the second part of the day, the US dollar did not receive support from the US industrial production report. Today, during the European session, the eurozone is not planning to disclose any reports. That is why the pair may continue trading sideways. To start an upward correctional process, the pair should rise and traders should show activity above 1.0833. A break and a downward test of this level will give a long signal, thus allowing the pair to recover to 1.0885. If the price exceeds this level, bulls will have a chance to push the pair to the highs of 1.0931 and 1.0970, where it is recommended to lock in profits. In case of a decline, traders should focus on the nearest support level of 1.0776. Only a false break of this level will give a buy signal. If the pair falls and buyers fail to protect 1.0776, it will be wise to avoid buying the asset. Traders could go long after a false break of a new monthly low of 1.0728. It is also possible to open long positions on the euro from 1.0636 or lower - from 1.0572, expecting a rise of 30-35 pips.
Conditions for opening short positions on EUR/USD:
Although sellers took the wait-and-see approach, they did not allow the euro/dollar pair to go above 1.0833, thus retaining the bearish sentiment. Today, sellers should first of all protect the nearest resistance level of 1.0833. A false break of this level will give a sell signal with the target at the new support level of 1.0776. To continue falling, the pair should reach a new local low. A break and an upward test of 1.0776 may cause a new sell-off of the euro, thus pushing it to the lows of 1.0728 and 1.0636, where it is recommended to lock in profits. A farther target is located at 1.0572. However, this scenario will become possible only in case of a jump in geopolitical tension. If the euro climbs in the first part of the day and bears fail to protect 1.0833, the currency may skyrocket. In this case, short positions could be initiated after a false break of 1.0885. Traders may also sell the asset from 1.0931 or higher – from 1.0970, expecting a decline of 25-30 pips.

COT report
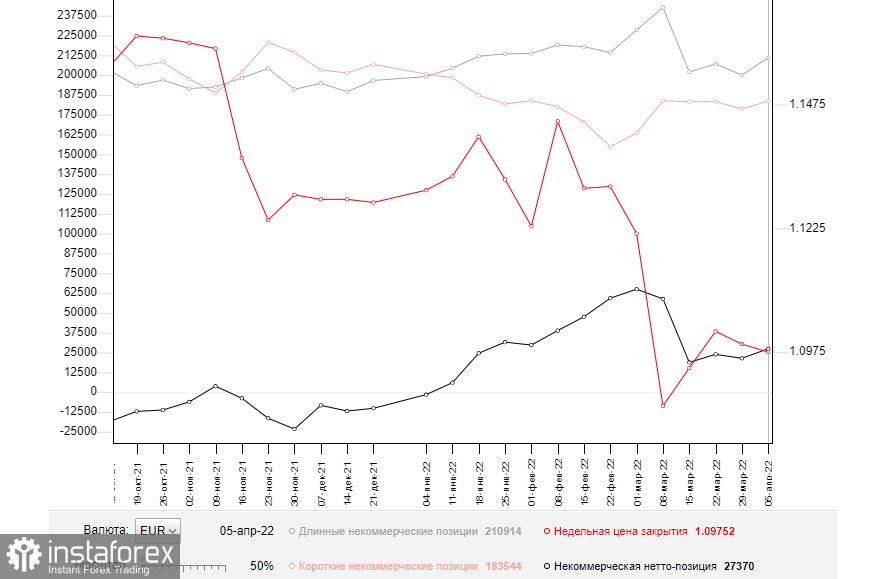
According to the COT report from April 5, the number of both long and short positions increased. Notably, the number of buyers exceeded the number of sellers. Such data could be explained by the expectations of new measures from the ECB. The regulator has been emphasizing the necessity of a more aggressive approach for the last few weeks. However, the absence of positive news about the Russia-Ukraine talks and rising geopolitical tension are still having a negative influence on the euro. That is why bulls cannot form a strong upward correction. In the near future, the US and the eurozone are going to disclose important inflation data. The reports will contain more accurate figures on the consumer price growth after the beginning of the special military operation in Ukraine. This information will provide politicians with hints about further actions on monetary policy. This, in turn, may help us to predict a future movement of the euro/dollar pair. According to the COT report, the number of long non-commercial positions increased to 210,914 from 200,043, while the number of short non-commercial positions climbed to 183,544 from 178,669. Since the rise in the number of short positions was less significant than a jump in the number of long positions, the general non-commercial net position advanced to 27,370 compared to 21,374. The weekly close price slid to 1.0776 from 1.0991.

Signals of indicators:
Moving Averages
Trading is performed above the 30- and 50-day moving averages, thus reflecting bears' return to the market.
Note: The period and prices of moving averages are considered by the author on the one-hour chart that differs from the general definition of the classic daily moving averages on the daily chart.
Bollinger Bands
If the euro advances, the upper limit of the indicator located at 1.0820 will act as resistance.
Description of indicators
- Moving average (moving average, determines the current trend by smoothing volatility and noise). The period is 50. It is marked in yellow on the chart.
- Moving average (moving average, determines the current trend by smoothing volatility and noise). The period is 30. It is marked in green on the graph.
- MACD indicator (Moving Average Convergence/Divergence - convergence/divergence of moving averages). A fast EMA period is 12. A slow EMA period is 26. The SMA period is 9.
- Bollinger Bands. The period is 20.
- Non-profit speculative traders are individual traders, hedge funds, and large institutions that use the futures market for speculative purposes and meet certain requirements.
- Long non-commercial positions is a total number of long positions opened by non-commercial traders.
- Short non-commercial positions is a total number of short positions opened by non-commercial traders.
- The total non-commercial net position is a difference in the number of short and long positions opened by non-commercial traders.


