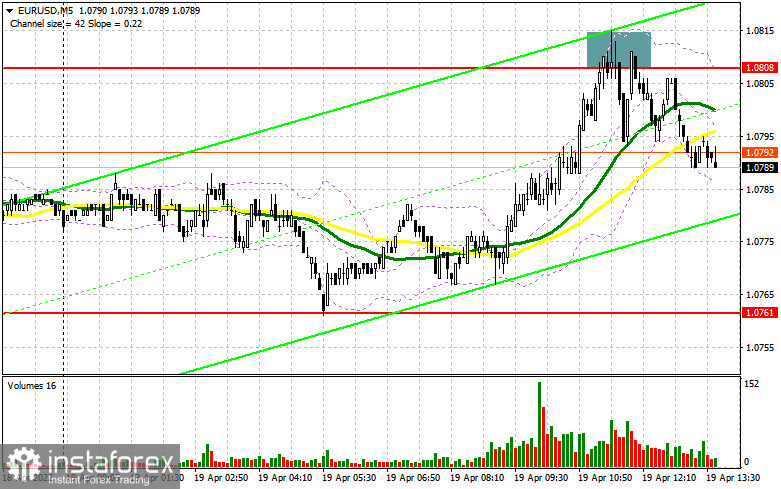
In my forecast this morning, I drew your attention to the level of 1.0808 and recommended entering the market from it. Let's have a look at the 5-minute chart and analyze what happened. We can see that in the absence of the statistics bulls used the momentum and brought the pair back to 1.0808. However, an unsuccessful attempt to consolidate higher together with the false breakout resulted in the sell signal. At the time of writing, the pair declined by about 20 pips and the pressure on the euro continued to grow. From the technical point of view, such a situation in the market did not lead to any changes. The trading plan for the second half of the day also remains the same.

Long positions on EUR/USD:
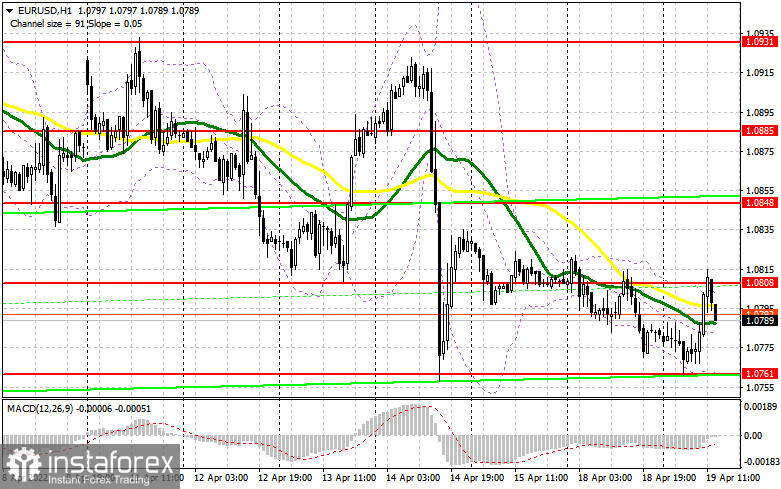
The fact that bulls failed to reach above 1.0808, indicates a restrained demand for risky assets. With the Federal Reserve representatives speaking this afternoon, the market could once again push the US dollar to the upside. FOMC member Charles Evans is likely to bring up the subject of interest rates, looking to combat high inflation, which is moving rapidly toward 9.0%. However, a new upward correction requires a rally and more actions from bulls above 1.0808, where the moving averages are passing, which are playing on the bears' side. A breakthrough and a top/bottom test of this level and the weak data on building permits and the new foundation starts in the US may create an entry signal into long positions, which would open the way for the pair's recovery to 1.0848. In case the pair rises above that level, which is unlikely, bulls may trigger bears' stop-loss orders and send the pair to the highs at 1.0885 and 1.0931, where traders may take profits. However, the aggravation of the geopolitical conflict and more active Russian military operation in Ukraine after the failed negotiations will restrain the demand for risky assets. The higher the euro recovers, the more interesting and attractive it may become for sellers betting on further growth of the US dollar expecting the Fed to raise interest rates in May. In case the EUR/USD pair declined in the second half of the day, the focus will remain on support at 1.0761. Only a false breakout at this level is likely to make a buy signal for the euro. If the pair falls and bulls show a lack of activity at 1.0761, it is better to postpone opening long positions. A false breakout near the new monthly low at 1.0723, will be the best option to enter into longs. Long positions on the euro can be opened on the rebound only from 1.0682, or even lower near 1.0636, allowing an upward intraday correction of 30-35 pips.
Short positions on EUR/USD:
Bears continue to sit on the fence. However, they managed to hold the price below the resistance of 1.0808, having formed a sell signal. As long as the trading is carried out below 1.0808, the pressure on the euro will increase, which might very quickly send the pair back to the morning support of 1.0761. However, bears need to protect a very important resistance at 1.0808. Another false breakout, in case of weak US statistics, will result in a new sell signal with the target at 1.0761. But to keep the bear market, it is important to reach new swing lows every day. While the pair fails to do this, there is no further trend development. Only a breakthrough and a bottom/top test of 1.0761 is likely to trigger a new sell-off of the euro sending the pair to the lows of 1.0723 and 1.0682, where traders may lock in profits. The next target is located in the area of 1.0636. IF the euro grows in the second half of the day and bears show weak activity at 1.0808, I expect a sharper rally in the pair. In this case, the best option to open short positions would be a false breakout formed around 1.0848. Selling the EUR/USD pair on a rebound is possible from 1.0885, or even higher near 1.0931, allowing a downward correction of 25-30 pips.

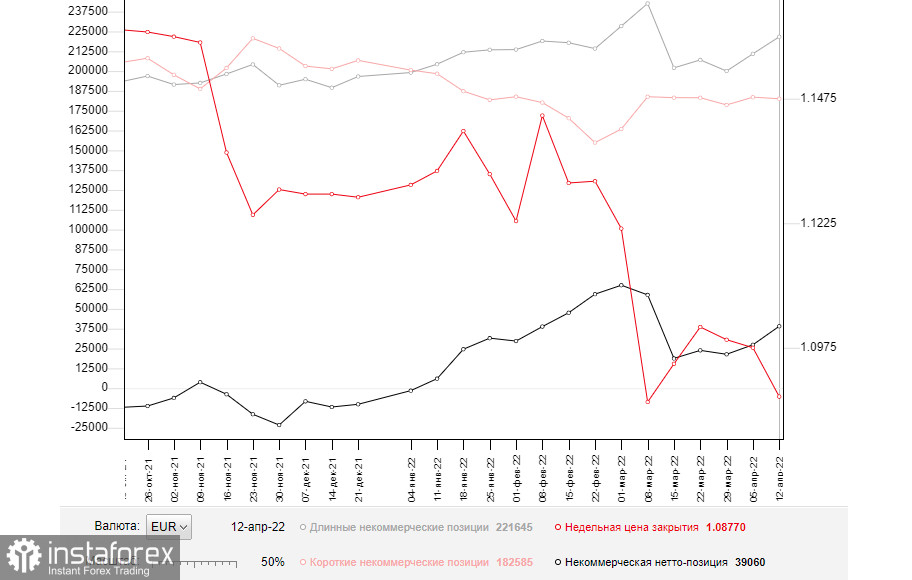
The COT (Commitment of Traders) report for April 12 logged a sharp rise in long positions and a slight decline in short positions. All this is characterized by positive expectations of new measures from the European Central Bank, about which Christine Lagarde told us last week. The fact that the ECB plans to completely end its bond-buying program by the third quarter of this year and begin raising interest rates at the same time indicates clear measures to combat high inflation in the eurozone, which is seriously affecting household incomes. Last week's data showed that the US consumer price index is also approaching its highest level in 40 years. This is forcing the Fed to act much more aggressively than before. Investors are expecting a 0.5% interest rate hike at the May meeting. Due to this, the US dollar continues to be in demand, which will continue to push the EUR/USD pair downwards. The increasing conflict between Russia in Ukraine and the lack of progress on its resolution also put pressure on the euro and will continue to do so. The COT report indicated that long non-commercial positions increased to 221,645 from 210,914, while short non-commercial positions decreased to 182,585 from 183,544. Despite the rise in long positions, the COT report is always secondary, and given how fast the market changes, these numbers do not tell the whole story right now. On the other hand, the declining euro makes it more attractive for investors, so the accumulation of long positions is not surprising. By the end of the week, the total net position grew to 39,060 from 27,370. The weekly closing price fell by almost 100 pips to 1.0877 from 1.0976.

Indicator signals:
Moving averages
The pair is trading near the 30- and 50-day moving averages, indicating that bulls are trying to build an upward correction.
Note: The period and prices of moving averages are considered by the author on the hourly chart H1 and differ from the general definition of classic daily moving averages on the daily chart D1.
Bollinger Bands
In the case of growth, the upper boundary of the indicator near 1.0810 will act as resistance. A breakthrough of the lower boundary of the indicator at 1.0761 will lead to a larger fall of the pair.
Indicators description
- Moving average defines the current trend by smoothing out volatility and noise. Period 50. Marked in yellow.
- Moving average defines the current trend by smoothing out volatility and noise. Period 30. Marked in green.
- MACD (Moving Average Convergence/Divergence) indicator Fast EMA of period 12. Slow EMA period 26. SMA period 9
- Bollinger Bands. Period 20
- Non-commercial traders are speculators, such as individual traders, hedge funds, and large institutions, which use the futures market for speculative purposes and meet certain requirements.
- Long non-commercial positions represent the total long open position of non-commercial traders.
- Short non-commercial positions represent the total short open position of non-commercial traders.
- Total non-commercial net position is the difference between short and long positions of non-commercial traders.


