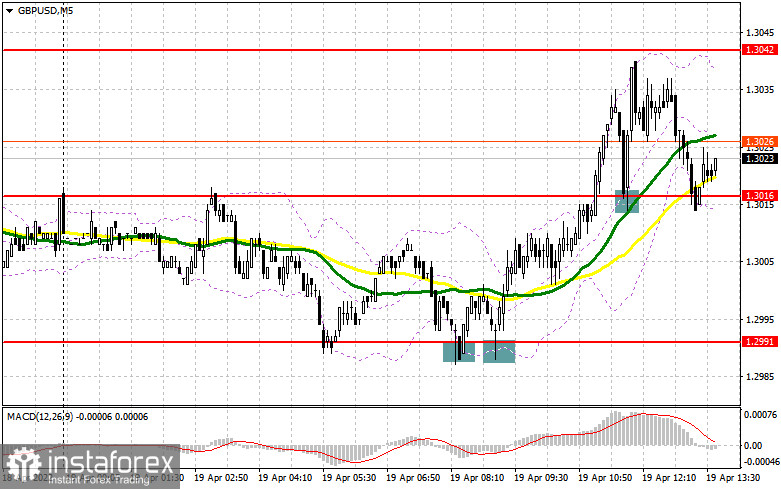
In the morning, I paid attention to the 1.2991 level and recommended searching for entry points from the mark. Let's now analyze the technical picture on the M5 chart. Two buy signals with the target at 1.3016 were made after a false breakout at 1.2991 during the European session and the unsuccessful attempt of bears to break below the mark. An additional buy signal was created as soon as the price broke and settled above the range. Eventually, the pound went up by about 25 pips but failed to touch the 1.3042 level. A profit of over 50 pips could have been made if you entered the market from 1.2991.

When to go long on GBP/USD:
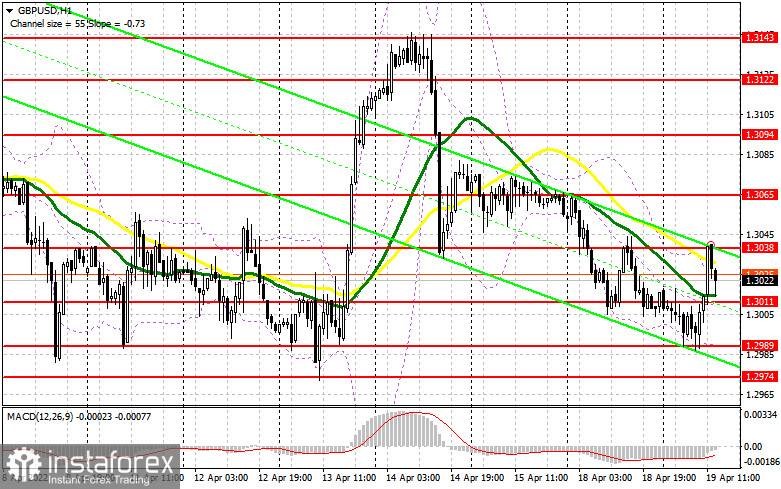
The technical picture has somewhat changed. So, nearest support and resistance are to be reviewed. It has been an expected rise in GBP provided by the lack of important fundamentals in the UK in recent days. FOMC member Charles Evans will deliver a speech later today. If his statement once again confirms the Fed's hawkish stance on monetary policy, it will be a bullish signal for the dollar. In the event of bearish GBP/USD, bulls will try to protect support at 1.3011. We may see the pair resuming growth with the target at 1.3038 or higher after a false breakout and the release of disappointing results on building permits and housing starts only. Due to the lack of fundamentals, however, bulls are unlikely to go above1.3038. An additional buy entry point will form after a breakout and a test of this range from top to bottom. In such a case, the 1.3094 high will stand as a target. You may consider profit taking at this level. In case of bearish GBP/USD and a decrease in bullish activity at 1.3011, pressure on the pair will mount. Therefore, you should look for buy entry points after a false breakout of support at 1.2989. Long positions on GBP/USD could also be entered on a bounce off 1.2974 or 1.2950, allowing a 30-35 pips correction intraday.
When to go short on GBP/USD:
Bears have failed to push the pair to the monthly low and quickly left the market. Should macro data come in strong in the US today, GBP/USD will go down. Bears will try to protect resistance at 1.3038, formed earlier today. A false breakout will create a nice sell signal. We may also see the quote breaking through 1.3011. A sell signal will be made after a breakout and a test of this range from top to bottom. If so, the targets will stand at lows of 1.2989 and 1.2974. You may consider profit taking at these levels. In the event of bullish GBP/USD and a decrease in bearish activity at 1.3038, you may look for sell entry points after a false breakout at 1.3065. Short positions on GBP/USD could also be entered on a bounce from the 1.3094 high, allowing a 30-35 pips downward correction intraday.

Commitments of Traders:
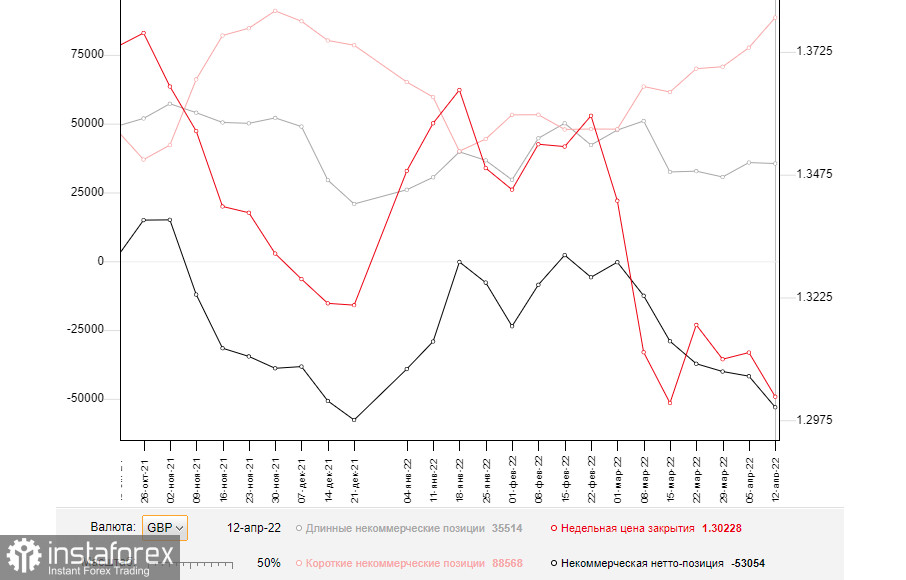
The Commitments of Traders report for April 12 logged a rise in short positions and a decrease in long ones. The results reflect market concerns over the current state of the British economy and persistent inflation. Thus, consumer prices increased to 7% in March, putting the Bank of England in a more difficult position. Experts say the situation will get even worse because inflationary risks weighing on the British economy are now difficult to evaluate. In this light, the dovish stance of Governor Bailey will be pushing prices higher. Additional pressure on the pound comes from the Fed's aggressive monetary policy stance. Unlike its British counterpart, the US economy is in a better state, which allows the American regulator to announce a rate hike at the meeting in May. It is also a signal to sell the pound. According to the COT report for April 12, long non-commercial positions fell to 35,514 from 35,873. Short non-commercial positions jumped to 88,568 versus 77,631. As a result, the negative value of non-commercial net positions grew to -53,054 from -41,758. The weekly closing price dropped to 1.3022 versus 1.3112.

Indicator signals:
Moving averages
Trading is carried out in the range between the 30-day and 50-day moving averages, indicating increased activity in the market.
Note: The period and prices of moving averages are viewed by the author on the hourly chart and differ from the general definition of classic daily moving averages on the daily chart.
Bollinger Bands
The lower band at 1.2989 stands as support. Resistance is seen at 1.3030 in line with the upper band.
Indicator description:
- Moving average (MA) determines the current trend by smoothing volatility and noise. Period 50. Colored yellow on the chart.
- Moving average (MA) determines the current trend by smoothing volatility and noise. Period 30. Colored green on the chart.
- Moving Average Convergence/Divergence (MACD). Fast EMA 12. Slow EMA 26. SMA 9.
- Bollinger Bands. Period 20
- Non-commercial traders are speculators such as individual traders, hedge funds, and large institutions who use the futures market for speculative purposes and meet certain requirements.
- Long non-commercial positions are the total long position of non-commercial traders.
- Non-commercial short positions are the total short position of non-commercial traders.
- Total non-commercial net position is the difference between short and long positions of non-commercial traders.


