Analysis of transactions Wednesday:
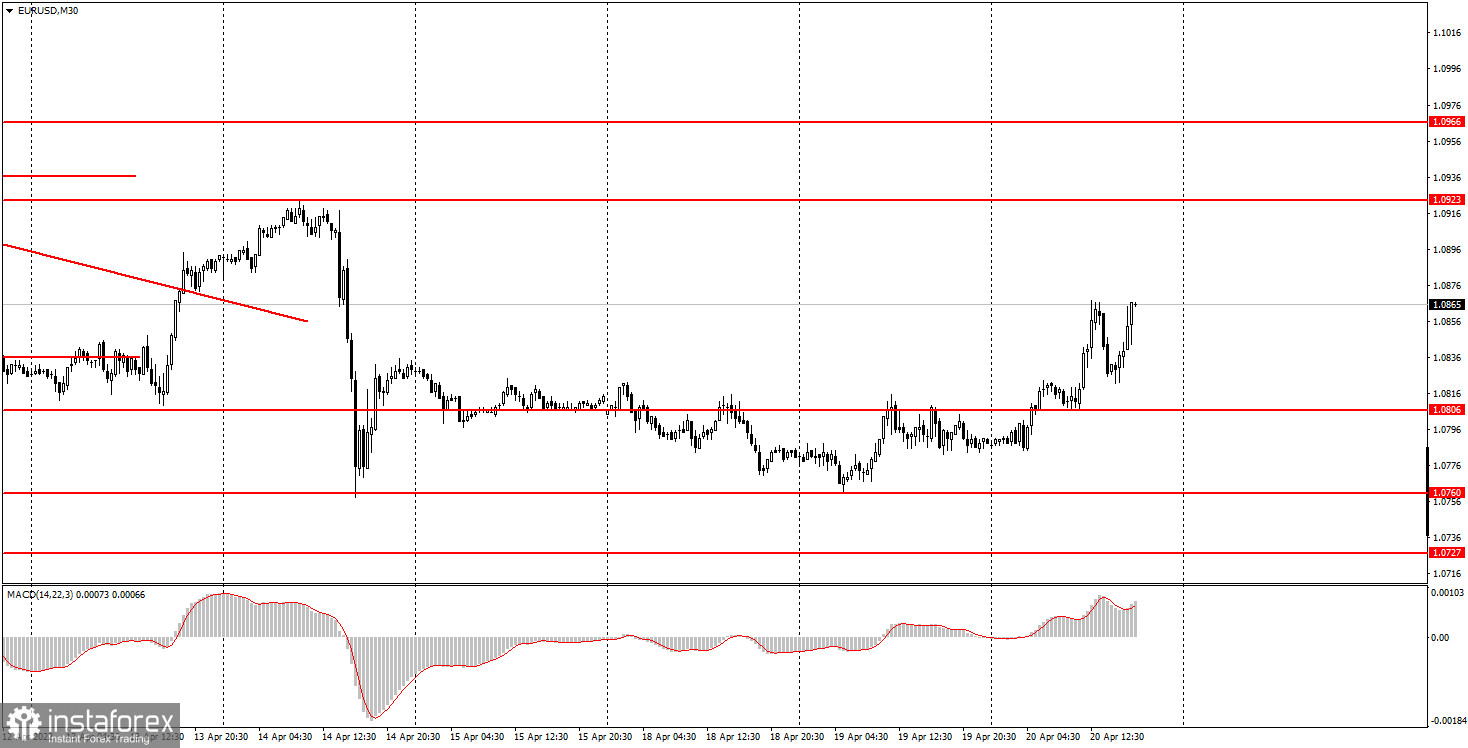
30M chart of the EUR/USD pair.

The EUR/USD currency pair on Wednesday, quite unexpectedly for many, did not continue its downward movement but began a long-awaited correction. During the day, the European currency rose by 80 points, which is much more than there was volatility on Monday or Tuesday. It cannot be said that there were a large number of important macroeconomic statistics or fundamental events on Wednesday. We can say that it was not at all. Neither the first nor the second. The report on industrial production in the European Union can hardly be considered an important event. And in any case, at the time of its publication, the pair has already begun to grow and has not yet begun to fall. Thus, there was no market reaction to it. And there were no other events scheduled for Wednesday. Even minor ones. The Fed's Beige Book economic review will be published tonight, but by that time traders will already have to close all transactions on the intraday system. This report rarely provokes a reaction in the market. As a result, the euro currency began to adjust, but so far this correction does not make it possible to count on a strong strengthening. We would start counting on the strong growth of the euro no earlier than overcoming the level of 1.0923.
5M chart of the EUR/USD pair.
In a 5-minute timeframe, the technical picture does not look the best. Mainly because during the day the pair also showed a fairly strong segment of the downward movement. Therefore, there was a trend, but there was also a strong pullback that confused all the cards. It should also be noted that today's maximum has not yet been formed, but it may act tomorrow as one of the levels near which signals are formed. Now let's move on to today's signals. The first buy order was formed at the beginning of the European session when the price bounced almost perfectly from the level of 1.0806. After that, it overcame the level of 1.0837 and went up about 25 more points. Total - 50 points after signal formation. Since the nearest target level of 1.0905 is far enough away, this transaction could be closed manually. It would be naive to count on the volatility of 120 points out of the blue. The next sell signal near the 1.0837 level turned out to be false. The pair was able to go down only 6 points after its formation. It brought a loss to the newcomers. But the next buy signal could compensate for the loss on the previous deal, as the pair went up about 20 points and stopped near the previous local high of the day. In any case, a couple of dozen points of profit could be earned today.
How to trade on Thursday:
On the 30-minute timeframe, the trend remains downward, despite the increase in quotes today. So far, this is not even a correction, it is a pullback since the pair failed to overcome the 1.0760 level twice. However, in the near future, the fall of the European currency may resume, since nothing has changed for it in fundamental, geopolitical, and macroeconomic terms. On the 5-minute TF tomorrow, it is recommended to trade by levels 1.0727, 1.0760, 1.0806, 1.0837, 1.0905, and 1.0923. When passing 15 points in the right direction, you should set the Stop Loss to breakeven. On Thursday, the European Union will publish an inflation report for March, but this is only the second, final value of this indicator. The market has already won back the increase to 7.5% y/y. Also in the afternoon, there will be speeches by Christine Lagarde and Jerome Powell, which can quite strongly affect the movement of the euro/dollar pair.
Basic rules of the trading system:
1) The strength of the signal is calculated by the time it took to generate the signal (rebound or overcome the level). The less time it took, the stronger the signal.
2) If two or more trades were opened near a certain level on false signals, then all subsequent signals from this level should be ignored.
3) In a flat, any pair can form a lot of false signals or not form them at all. But in any case, at the first signs of a flat, it is better to stop trading.
4) Trade transactions are opened in the period between the beginning of the European session and the middle of the American session when all transactions must be closed manually.
5) On a 30-minute TF, signals from the MACD indicator can be traded only if there is good volatility and a trend, which is confirmed by a trend line or a trend channel.
6) If two levels are located too close to each other (from 5 to 15 points), then they should be considered as a support or resistance area.
What's on the charts:
Price support and resistance levels - the levels that are the targets when opening purchases or sales. Take Profit levels can be placed near them.
Red lines - channels or trend lines that display the current trend and show in which direction it is preferable to trade now.
MACD indicator (14, 22, 3) - a histogram and a signal line – an auxiliary indicator that can also be used as a signal source.
Important speeches and reports (always contained in the news calendar) can greatly influence the movement of a currency pair. Therefore, during their exit, it is recommended to trade as carefully as possible or exit the market to avoid a sharp price reversal against the previous movement.
Forex beginners should remember that every trade cannot be profitable. The development of a clear strategy and money management are the keys to success in trading over a long period.


