


Trend analysis (Fig. 1)
GBP/USD will move down from 1.3025 (closing of yesterday's daily candle) to 1.2944, which is the lower limit of the Bollinger band indicator (dashed black line). Then, it will go to 1.2997, the 14.6% retracement level (red dotted line).
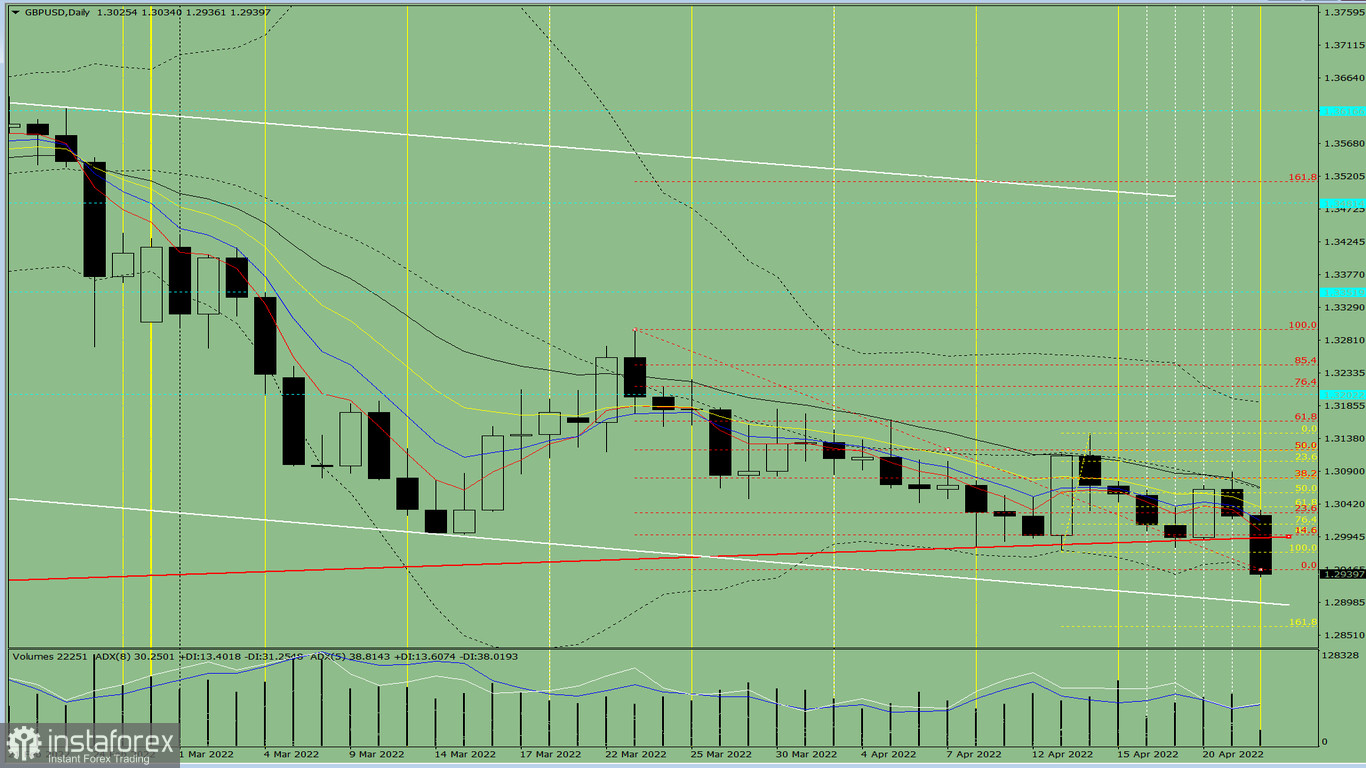
Fig. 1 (daily chart)
comprehensive analysis:
Indicator analysis - downtrend
Fibonacci levels - downtrend
volumes - downtrend
Candlestick analysis - downtrend
Trend analysis - uptrend
Bollinger bands - downtrend
Weekly chart - downtrend
Conclusion: GBP/USD will continue to decline, from the closing of yesterday's daily candle at 1.3025 to the lower limit of the Bollinger band indicator at 1.2944 (black dotted line). Then, it will go to 1.2997, the 14.6% retracement level (red dotted line).
There is little chance that the pair will dip from 1.3025 (closing of yesterday's daily candle) to the support line at 1.2897 (thick white line), then bounce back to the 14.6% retracement level at 1.2997 (red dotted line).


