


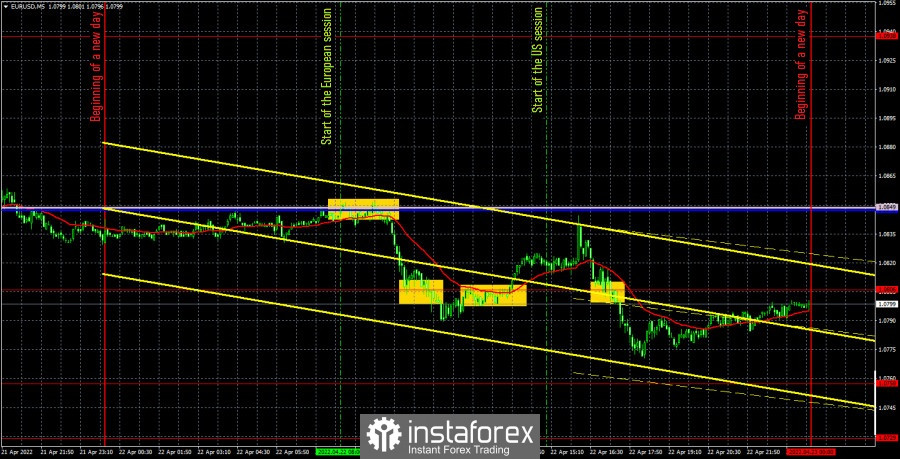
EUR/USD 5M
The EUR/USD pair failed to show growth again last Friday. It should be recognized that macroeconomic statistics in the EU and the US clearly did not contribute to the pair's upward movement. Moreover, the "foundation", which has remained very difficult for the euro in recent months, also acquired a touch of farce last week. First, European Central Bank Vice-President Luis de Guindos announced a possible increase in the key rate already in July, which clearly put ECB President Christine Lagarde into a stupor, who had been repeating for months that tightening monetary policy in 2022 could be forgotten. A little later, Lagarde refused to comment on a possible rate hike in July 2022. Thus, the market last week did not always even understand how to react to what was happening. On Friday, the indices of business activity in the services and manufacturing sectors of the United States and the EU had no effect on the euro/dollar pair's movement. This is clearly not the data that can cause a market reaction right now.
But the trading signals on Friday were quite interesting. The first sell signal was formed at the very beginning of the European trading session, when the price bounced off the Senkou Span B and Kijun-sen lines. Subsequently, it went down about 45 points, overcame the extreme level of 1.0806, but could not continue falling even further down. Thus, when a buy signal was formed (consolidating the price above 1.0806), it was necessary to close short positions and open longs. We could not earn from long positions, since the price could not reach the Kijun-sen target line by 3 points. The long position closed at a Stop Loss at breakeven. The last sell signal could bring a couple of dozen points of profit, but it should have been closed manually later in the evening. Thus, traders received two profitable signals on Friday.
COT report:
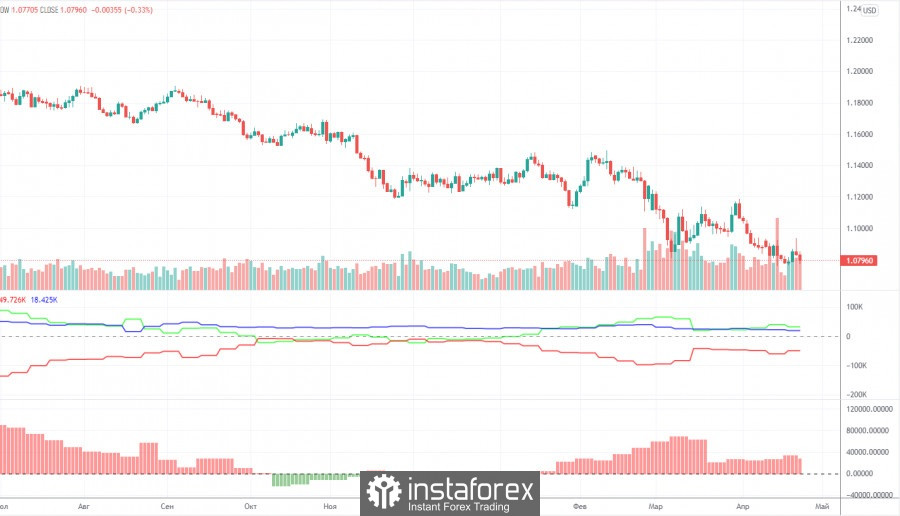
The latest Commitment of Traders (COT) reports on the euro raised more questions than they provided answers! Major players, starting from January 2022, maintain a bullish mood. And the euro, starting from January 2022, maintains a downward trend. During the reporting week, the number of long positions decreased by 600, and the number of shorts from the "non-commercial" group increased by 7,000. Thus, the net position decreased by 6,000 contracts. This means that the bullish mood has weakened a bit. However, it still remains bullish, since the number of long positions now exceeds the number of short positions with non-commercial traders by 32,000. Accordingly, the paradox lies in the fact that professional players generally buy euros more than they sell, but the euro continues to fall almost non-stop, which is clearly seen in the chart above. We have already explained earlier that this effect is achieved by a higher demand for the US dollar. The demand for the dollar is higher than the demand for the euro, which is why the dollar is rising against the euro. There is such an effect "due" to the geopolitical conflict in Ukraine. Therefore, the data of COT reports on the euro now do not give an opportunity to predict the further movement of the pair. The longer the phase of active hostilities in Ukraine persists, the higher the probability of a collision between the European Union and the food and energy crisis, and the dollar will continue to grow due to its status as a "reserve" currency.
We recommend to familiarize yourself with:
Overview of the EUR/USD pair. April 25. European GDP and inflation. Will they help the euro currency?
Overview of the GBP/USD pair. April 25. Will the pound be able to recover from the shocks of last week?
Forecast and trading signals for GBP/USD on April 25. Detailed analysis of the movement of the pair and trading transactions.
EUR/USD 1H
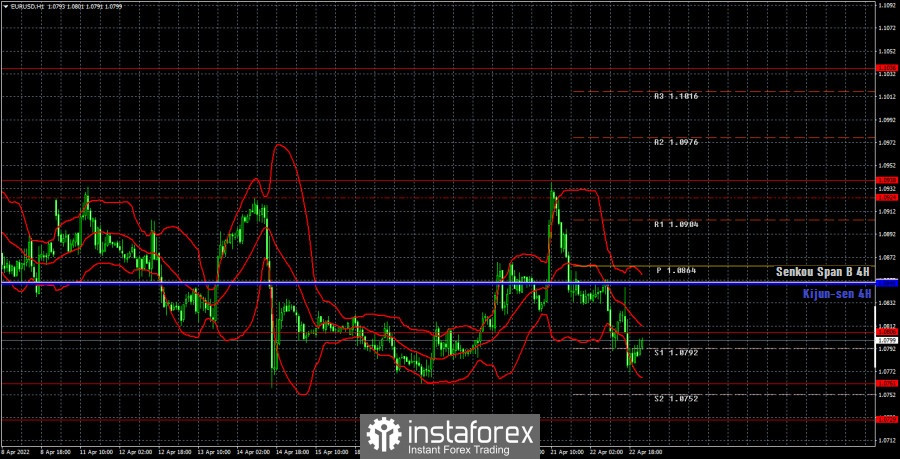
It can be seen on the hourly timeframe that the pair has resumed its downward movement, but at the moment it is again close to its 15-month lows. Thus, most likely it will continue to slide down at a not too hasty pace. There is still no trend line or channel, and the downward trend is better visible on the higher TF – it has become too long on the hourly TF and simply does not fit completely into the chart. We allocate the following levels for trading on Monday – 1.0729, 1.0761, 1.0806, 1.0924 (support level), 1.0938, as well as the Senkou Span B (1.0848) and Kijun-sen (1.0848) lines. The lines of the Ichimoku indicator can move during the day, which should be taken into account when determining trading signals. There are also secondary support and resistance levels, but no signals are formed near them. Signals can be "bounces" and "breakthrough" levels - extremes and lines. Do not forget about placing a Stop Loss order at breakeven if the price went in the right direction of 15 points. This will protect you against possible losses if the signal turns out to be false. There are no important events or publications scheduled for April 25 in the European Union and the US. Thus, traders will have nothing to react to today, the pair is unlikely to be able to continue falling, and volatility is likely to be low.
Explanations for the chart:
Support and Resistance Levels are the levels that serve as targets when buying or selling the pair. You can place Take Profit near these levels.
Kijun-sen and Senkou Span B lines are lines of the Ichimoku indicator transferred to the hourly timeframe from the 4-hour one.
Support and resistance areas are areas from which the price has repeatedly rebounded off.
Yellow lines are trend lines, trend channels and any other technical patterns.
Indicator 1 on the COT charts is the size of the net position of each category of traders.
Indicator 2 on the COT charts is the size of the net position for the non-commercial group.


