


GBP/USD 5M
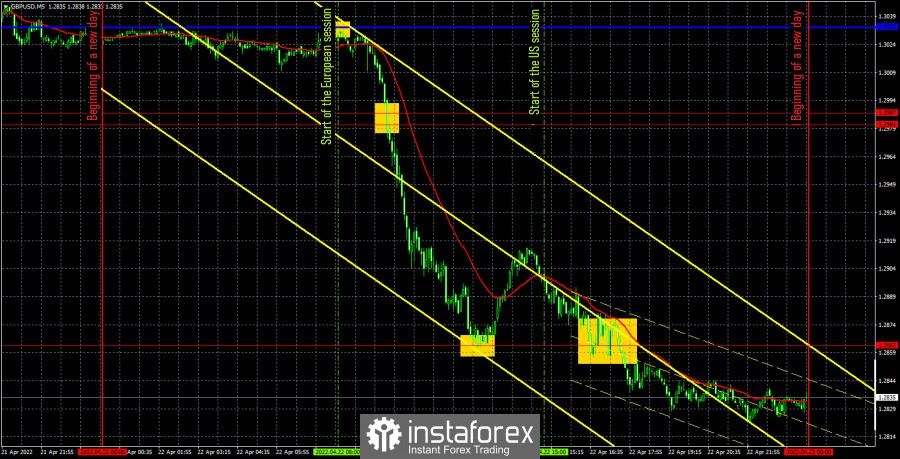
The GBP/USD currency pair fell by 220 points on Friday. In general, if the fall simply continued at a calm pace, no one would be surprised. We have repeatedly said that the absolute majority of factors support the further growth of the US currency. However, the pound was not just declining on Friday, it was falling like a stone. And, most likely, there was no single event that became the "culprit" of what happened. Simply because during the day there was, in principle, no event that could provoke a movement of 200 points. Recall that even after the central banks' meetings, such forces of movement do not always occur. Thus, the overall technical picture has not changed at all, but after such a strong fall, we now expect an upward correction. Most likely, the market needed such a powerful movement to finally overcome the level of 1.2981. Now the further way down is open.
There were few trading signals on Friday. But almost all are profitable. The first signal was formed near the Kijun-sen line at the very beginning of the European session. After that, the pair showed a drop of 150 points and stopped only near the extreme level of 1.2863. Naturally, this signal should have been worked out. The buy signal near the 1.2863 level turned out to be false, although after its formation the price went up 40 points. However, there were no target levels nearby, so the long position closed at breakeven on Stop Loss. The next signal – for short positions – was formed when the level of 1.2863 was overcome and it was possible to earn about 20 points on it, and it had to be closed manually. In total, it was possible to get about 150 points of profit on Friday. It is not too difficult to earn money on good trend movements.
COT report:
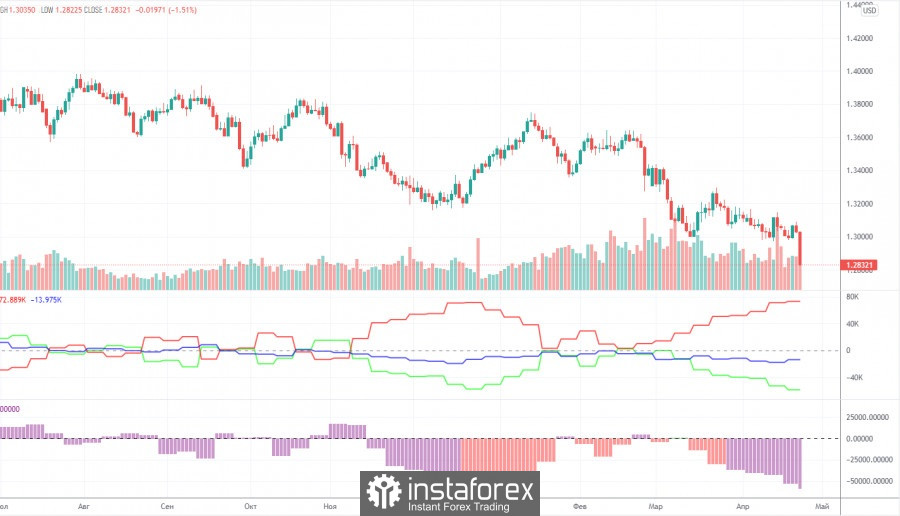
The latest Commitment of Traders (COT) report on the British pound has witnessed a new strengthening of the bearish mood among commercial traders. During the week, the non-commercial group opened 1,300 long positions and 7,100 short positions. Thus, the net position of non-commercial traders decreased by another 6,000. Such changes are significant for the pound. The non-commercial group has already opened a total of 95,700 short positions and only 36,800 long positions. Thus, the difference between these numbers is almost threefold. This means that the mood of commercial traders is now "pronounced bearish". Thus, this is another factor that speaks in favor of the continuation of the pound's decline. Note that in the pound's case, the COT report data very accurately reflects what is happening in the market. According to the pound, the mood of the major players changes every couple of months, but at this time it fully corresponds to the movement of the pound/dollar pair. The net position of the "non-commercial" group has already fallen to the levels where the last round of the pound's fall ended (the green line on the first indicator). Thus, we can even assume that in the coming weeks the pound will try to start a new ascent. However, the current fundamental and geopolitical background does not give good reasons to expect a strong growth of the British currency.
We recommend to familiarize yourself with:
Overview of the EUR/USD pair. April 25. European GDP and inflation. Will they help the euro currency?
Overview of the GBP/USD pair. April 25. Will the pound be able to recover from the shocks of last week?
Forecast and trading signals for EUR/USD on April 25. Detailed analysis of the movement of the pair and trading transactions.
GBP/USD 1H
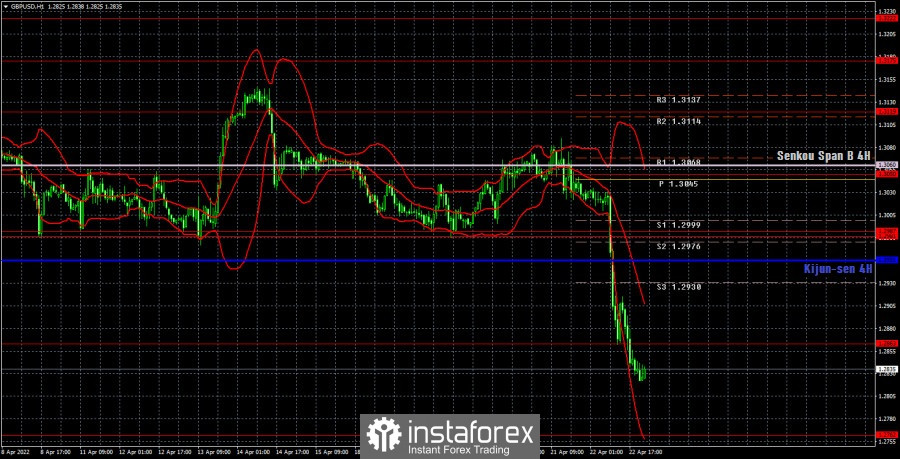
The pound continues to remain in a downward trend on the hourly timeframe and has updated its 15-month lows. Thus, the overall technical picture does not change in any way. We expect to see an upward pullback on Monday and Tuesday, maybe even a tangible correction, but this week it will be extremely difficult to count on the pound's growth based on "macroeconomics" or "foundation". We highlight the following important levels on April 25: 1.2762, 1.2863, 1.2981-1.2987, 1.3050, 1.3119, 1.3175. The Senkou Span B (1.3060) and Kijun-sen (1.2955) lines can also be signal sources. Signals can be "bounces" and "breakthroughs" of these levels and lines. It is recommended to set the Stop Loss level to breakeven when the price passes in the right direction by 20 points. The lines of the Ichimoku indicator can move during the day, which should be taken into account when determining trading signals. There are also support and resistance levels on the chart that can be used to take profits on transactions. There are no important events and reports scheduled for Monday in the UK and the US. Thus, it is unlikely for the pound to continue its decline today, and there is also unlikely to be high volatility. However, this does not mean that there will be no movements in principle. Not every Monday is "boring".
Explanations for the chart:
Support and Resistance Levels are the levels that serve as targets when buying or selling the pair. You can place Take Profit near these levels.
Kijun-sen and Senkou Span B lines are lines of the Ichimoku indicator transferred to the hourly timeframe from the 4-hour one.
Support and resistance areas are areas from which the price has repeatedly rebounded off.
Yellow lines are trend lines, trend channels and any other technical patterns.
Indicator 1 on the COT charts is the size of the net position of each category of traders.
Indicator 2 on the COT charts is the size of the net position for the non-commercial group.


