


Trend analysis
EUR/USD will attempt to move down this week, from 1.0800 (closing of the last weekly candle) to the support line at 1.0669 (white thick line). Then, it will go to the lower fractal at 1.0757 (red dotted line).
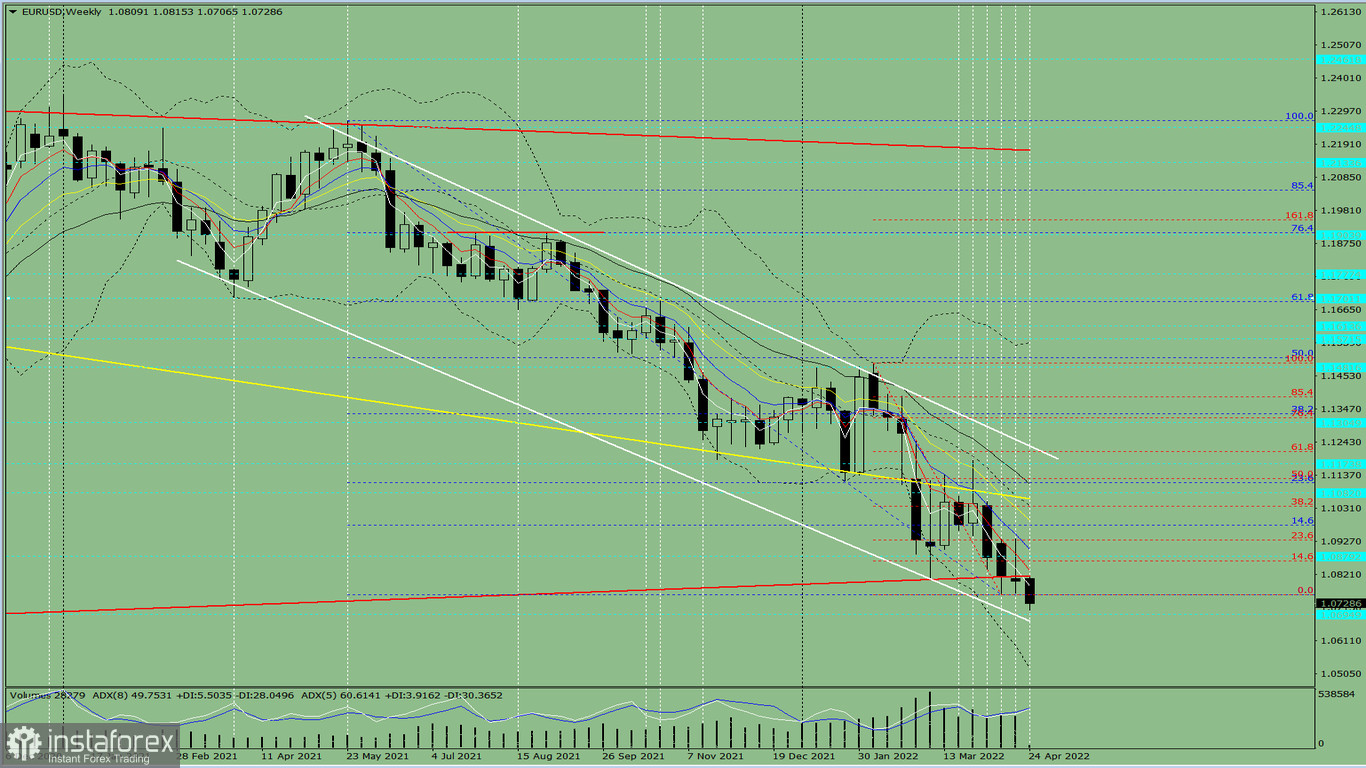
Fig. 1 (weekly chart)
Comprehensive analysis:
Indicator analysis - downtrend
Fibonacci levels - downtrend
Volumes - downtrend
Candlestick analysis - uptrend
Trend analysis - downtrend
Bollinger bands - downtrend
Monthly chart - downtrend
All this points to a downward movement in EUR/USD.
Conclusion: The pair will have a downward trend, with no first upper shadow on the weekly black candle (Monday - down) and a second lower shadow (Friday - up).
And during the week, the price will fall from 1.0800 (closing of the last weekly candle) to the support line at 1.0669 (white thick line), then move to the lower fractal at 1.0757 (red dotted line).
Alternatively, the quote could attempt to dip from 1.0800 (closing of the last weekly candle) to the support line at 1.0669 (white thick line), then go to the lower limit of the Bollinger Band indicator at 1.0521 (black dotted line).


