


GBP/USD
Analysis:
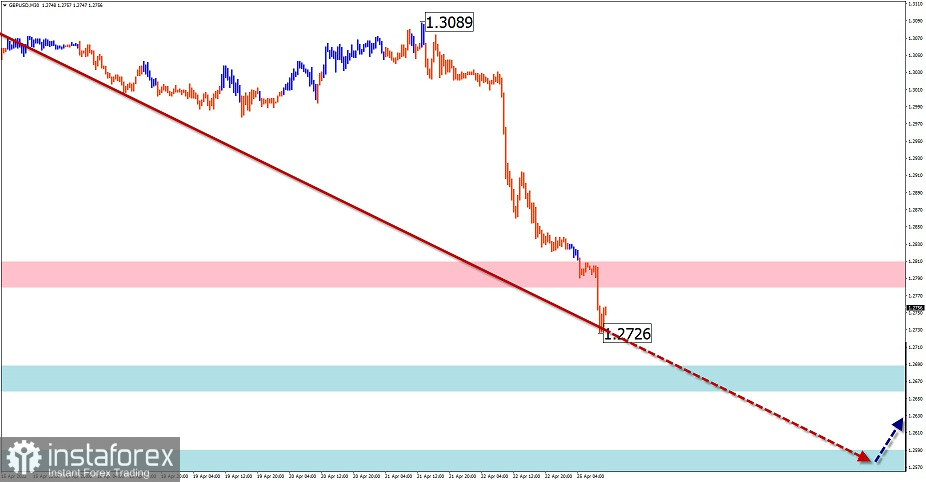
Today, the British pound sterling keeps moving to the downside. In the course of a decline, the price has approached the upper boundary of a wide potential reversal zone on a monthly chart. The structure of the entire trend wave looks complete but there are no signals of an imminent trend reversal.
Forecast:
In the next 24 hours, the price is likely to stay within the downtrend. A short-term price rebound no further than the estimated resistance level is also possible in the coming sessions. Trading activity is likely to increase by the end of the day. If the price breaks through the nearest support zone, the decline will continue until the next estimated support.
Potential reversal zones
Resistance:
- 1.2780/1.2810
Support:
- 1.2690/1.2660
- 1.2590/1.2560
Recommendations:
On the GBP/USD chart today, it is recommended to track all emerging sell signals when the price completes a pullback. The likelihood of a pullback from the support zone is very high.
AUD/USD
Analysis:
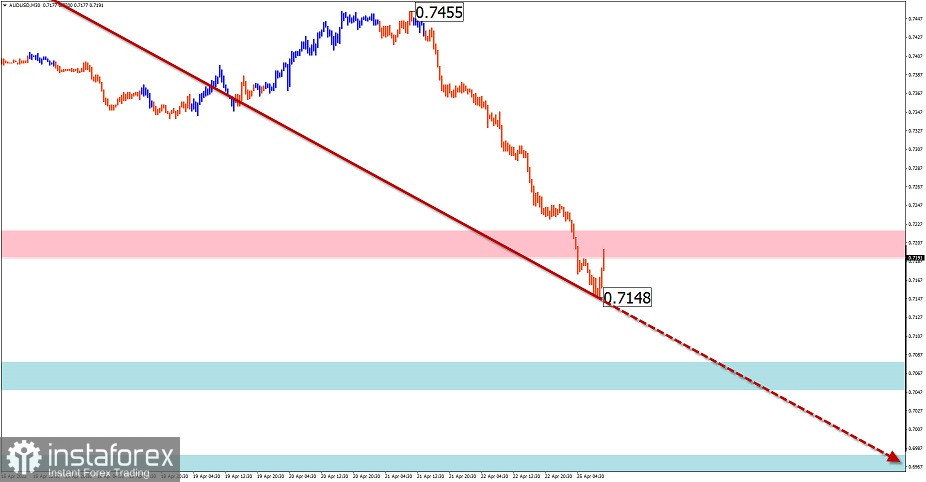
Since last February, AUD/USD has been forming a descending wave. An unfinished section of this structure dates back to April 5. The price is approaching the upper limit of a strong support zone on a higher time frame. There are currently no signs of an early wave completion and a reversal on the chart.
Forecast:
In the coming sessions, the pair is expected to continue the overall downtrend. In the first half of the day, a short-term breakout and a rise towards the estimated resistance area are possible. The highest trading activity is expected later in the day or tomorrow.
Potential reversal zones
Resistance:
- 0.7190/0.7220
Support:
- 0.7080/0.7050
- 0.6980/0.6950
Recommendations:
Today, there are no opportunities for buying the pair. It is advisable to track emerging reversal signals to sell the pair when the price completes its rise.
USD/CHF
Analysis:
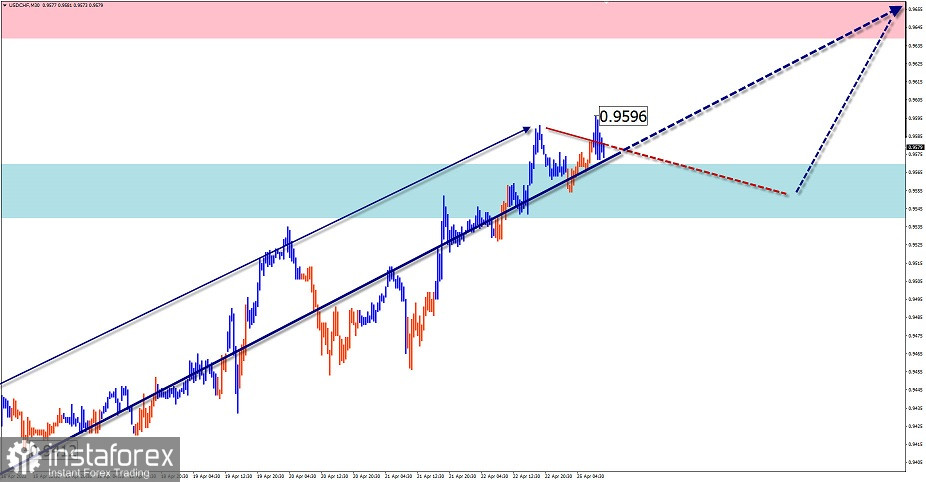
The USD/CHF pair has been developing an uptrend since the beginning of the year. Following an active advance in the course of the month, the major pair has reached the lower line of the strong resistance on the weekly chart. At the moment of writing, there are currently no signals of an upcoming reversal.
Forecast:
Today, the pair is expected to continue its upward movement. After a flat movement in the first half of the day, we can expect higher trading activity in the evening. The price is likely to pull back from the current resistance zone.
Potential reversal zones
Resistance:
- 0.9640/0.9670
Support:
- 0.9570/0.9540
Recommendations:
It is possible to open buy positions in the USD/CHF market with a fractional lot from the current resistance level. Pullbacks are very likely in this case.
USD/CAD
Analysis:
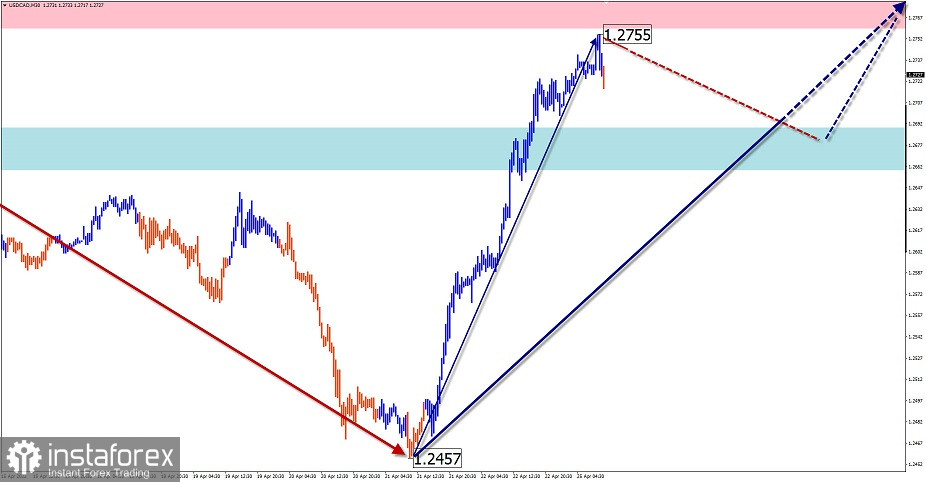
The lack of a clear trend on the USD/CAD chart is explained by the formation of a sideways channel. The ascending section of this wave, which was formed on April 21, is not complete. The rally at the end of last week brought the quotes to the zone of the weekly time frame.
Forecast:
In the coming days, the price is expected to enter a sideways channel formed by the two opposite zones. A downtrend is more likely during the European session. By the end of the day or tomorrow, the pair may resume an uptrend.
Potential reversal zones
Resistance:
- 1.2760/1.2790
Support:
- 1.2690/1.2660
Recommendations:
Today, trading USD/CAD can be risky and may result in losses. It is recommended to refrain from entering the market until the price completes a pullback. It is better to track buy signals near the area of support.
Explanation: In simplified wave analysis (SWA), waves consist of 3 parts (A-B-C). We analyze the last unfinished wave. The solid arrow background shows the structure that has been formed. The dashed lines show the expected movements.
Note: The wave algorithm does not take into account the duration of the instrument's movements over time!


