


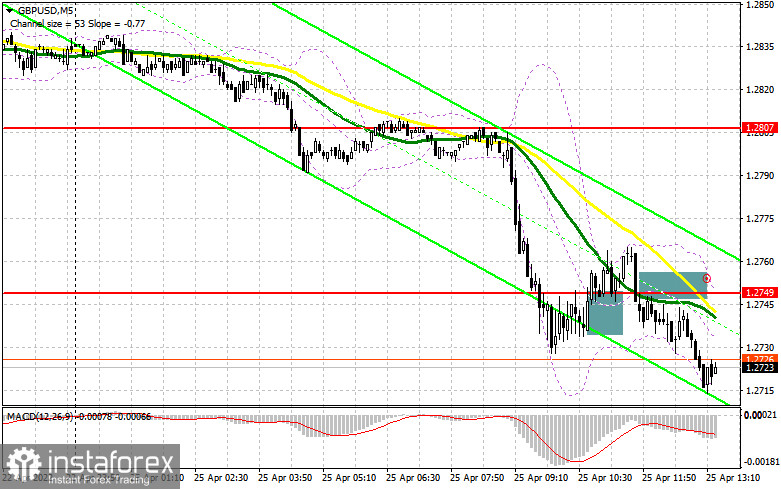
In the first half of the day, several signals were formed to enter the market, but not all of them turned out to be profitable. Let's look at the 5-minute chart and figure out what happened. In my morning forecast, I paid attention to the level of 1.2749. A breakout, and then a return to this range with a top-down test - all this led to a buy signal based on an upward correction after a major Asian sell-off of the pair. However, I did not receive an accentuated upward movement. After several unsuccessful attempts to move the pair, and they gave a maximum of about 20 points of profit, the pressure on the pound returned. The breakthrough and the reverse test of 1.2749 have already formed an excellent sell signal from the bottom up in the continuation of the decline of GBP/USD. At the time of writing, the downward movement has already amounted to more than 35 points. And what were the entry points for the euro this morning?
To open long positions on GBP/USD, you need:
The pressure on the pound remains, and it is unlikely that anything will change significantly in the near future since there are no reasons for this. The statements of the Governor of the Bank of England, Andrew Bailey, that there is not so much time left before the recession of the economy, were enough for the pound to continue updating its annual lows. Buyers today will not be able to take advantage of American statistics since there is none. For this reason, I expect the pressure on the pair to remain. Only the protection of the nearest support of 1.2689, to which the pound is now purposefully moving, and the formation of a false breakdown on it will give a signal to open long positions against the trend, counting on an upward correction to the area of 1.2749. It is hardly possible to expect a sharper upward jerk, but anything happens. Therefore, a breakthrough and consolidation above 1.2749 with a reverse test from top to bottom will give a buy signal with a view to growth to 1.2807, where I recommend fixing the profits. In the case of a decline in the pound and the absence of buyers at 1.2689, and this is also very possible, it is best to postpone purchases until the next support of 1.2645. I advise you to enter the market there only if there is a false breakdown. It is possible to buy GBP/USD immediately for a rebound from the minimum of 1.2585, or even lower - in the area of 1.2517 and only with the aim of correction of 30-35 points within a day.
To open short positions on GBP/USD, you need:
Bears control the market, and it is better to sell on growth. Sellers will do everything to keep the pair above 1.2749. The formation of a false breakdown at this level will be an excellent sell signal. When implementing this scenario, you can also count on the 1.2689 update. A breakout and a reverse test from the bottom up of this range will lead to the formation of an additional sell signal that can collapse the pound to 1.2645. A more distant target will be the 1.2585 area, where I recommend fixing the profits. In the scenario of GBP/USD growth and lack of activity at 1.2749, I advise you to postpone short positions to a larger resistance of 1.2807, where the moving averages are playing on the side of bears. I also advise you to open short positions there only in case of a false breakdown. You can sell GBP/USD immediately for a rebound from 1.2856, counting on the pair's rebound down by 30-35 points within a day.
The COT report (Commitment of Traders) for April 12 recorded an increase in short positions and a reduction in long ones. All this once again confirmed the attitude of traders to the British economy, which is teetering on the brink of recession mixed with the highest inflation for a long period. The sharp rise in the consumer price index in March this year to another maximum of 7.0% once again proved the complexity of the situation in which the Bank of England found itself, but the report on UK GDP, on the contrary, did not please traders much. The situation will only worsen, as future inflation risks are now quite difficult to assess due to the difficult geopolitical situation, but the consumer price index will continue to grow in the coming months. At the same time, the soft position of the governor of the Bank of England will push prices up. The pressure on the pound is also increasing due to the aggressive policy of the Federal Reserve System, which is becoming more hawkish every day. In the US, there are no such problems with the economy as in the UK, so there the Fed can raise rates more actively, which it is going to do during the May meeting - another signal in the direction of selling the pound against the US dollar. The COT report for April 12 indicated that long non-commercial positions decreased from the level of 35,873 to the level of 35,514, while short non-commercial positions jumped from the level of 77,631 to the level of 88,568. This led to an increase in the negative value of the non-commercial net position from -41,758 to -53,054. The weekly closing price decreased from 1.3112 to 1.3022.
Signals of indicators:
Moving averages
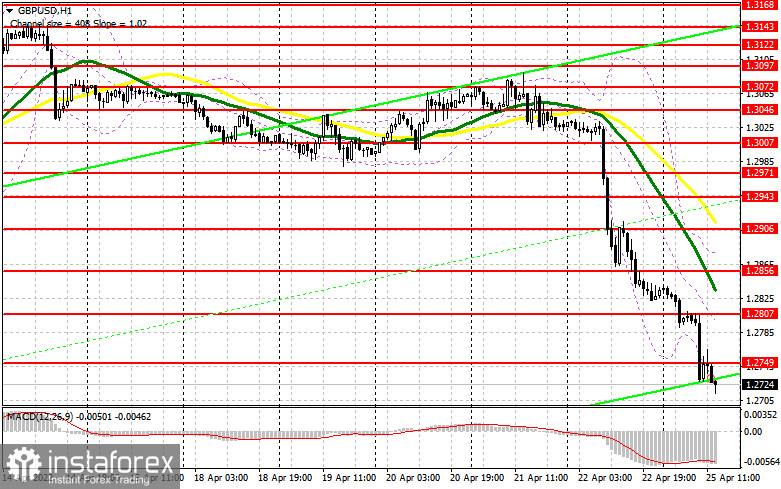
Trading is below 30 and 50 daily moving averages, which indicates the resumption of the bear market for the pound.
Note. The period and prices of moving averages are considered by the author on the hourly chart H1 and differ from the general definition of the classic daily moving averages on the daily chart D1.
Bollinger Bands
In the case of growth, the average border of the indicator in the area of 1.2856 will act as resistance.
Description of indicators
- Moving average (moving average determines the current trend by smoothing out volatility and noise). Period 50. The graph is marked in yellow.
- Moving average (moving average determines the current trend by smoothing out volatility and noise). Period 30. The graph is marked in green.
- MACD indicator (Moving Average Convergence / Divergence - moving average convergence/divergence) Fast EMA period 12. Slow EMA period 26. SMA period 9
- Bollinger Bands (Bollinger Bands). Period 20
- Non-profit speculative traders, such as individual traders, hedge funds, and large institutions use the futures market for speculative purposes and to meet certain requirements.
- Long non-commercial positions represent the total long open position of non-commercial traders.
- Short non-commercial positions represent the total short open position of non-commercial traders.
- Total non-commercial net position is the difference between the short and long positions of non-commercial traders.


