


Analyzing trades on Monday:
GBP/USD on 30M chart
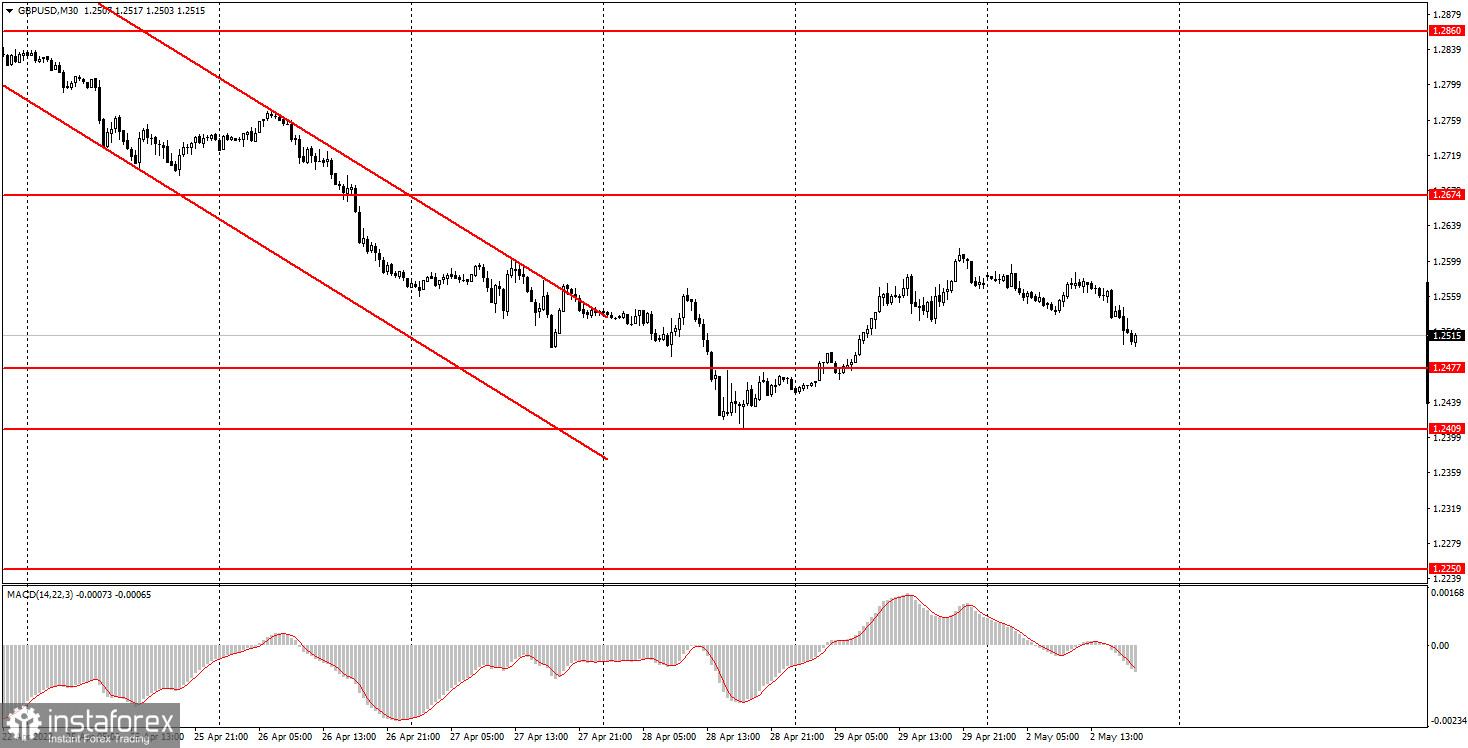
On Monday, GBP/USD failed to extend its upward correction initiated on Friday. Instead, the pound sterling was sliding for the whole day. Although the quotes have left the descending channel, the downtrend still persists. At the moment, everything confirms a further decline in the pound and a rise in the US dollar. It is true that the fall in the pair has already been deep enough, and the market has priced in all the factors. Yet, it is not recommended to open new trades based on this. Today, there were no major reports or other important events in the UK, so the market had no drivers. However, as we can see, the pair did not need any external factors as it moved by almost 100 pips during the day. So the trend movement was strong.
GBP/USD on 5M chart
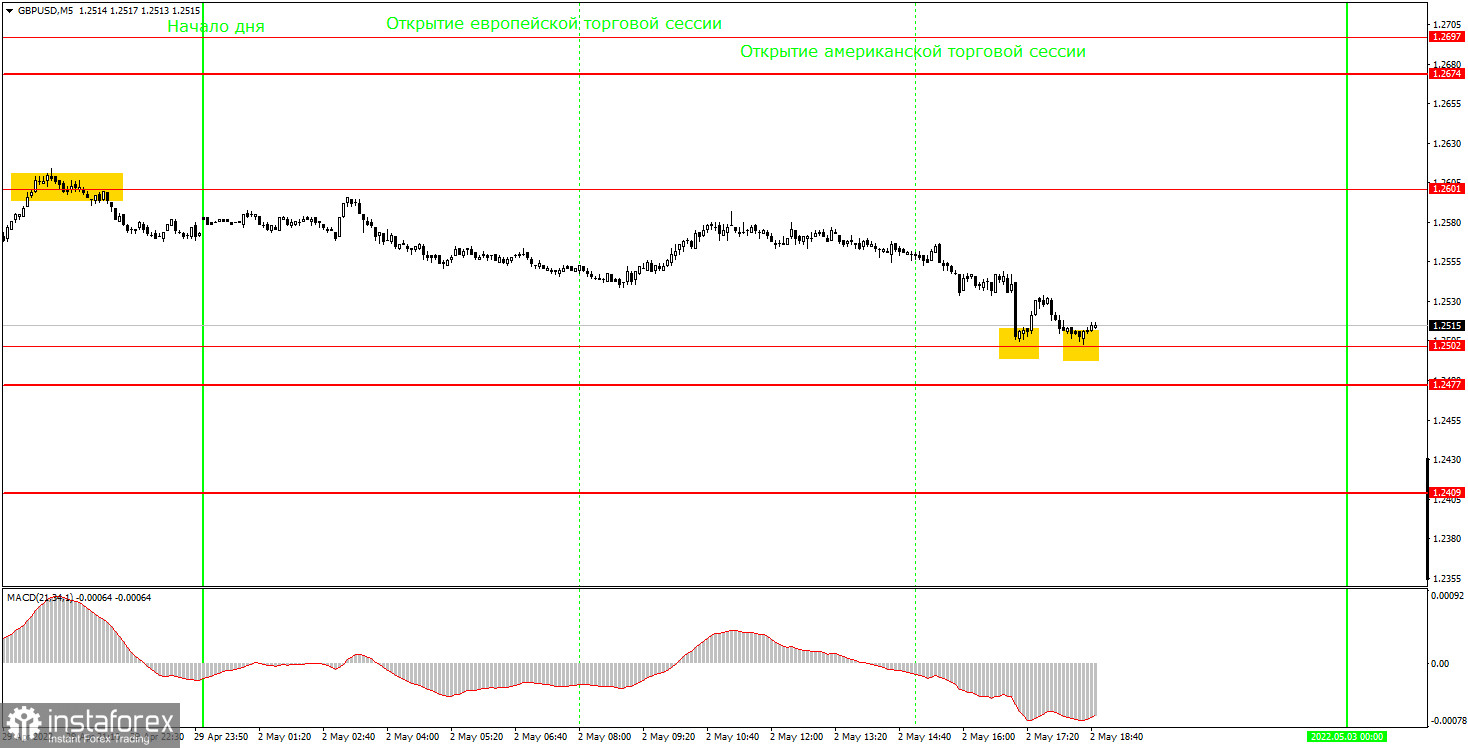
On the 5-minute time frame, the pair was moving smoothly within the trend without sharp pullbacks or corrections. However, not a single trading signal was formed during the European session. So, beginners missed the trend unless they simultaneously used other trading systems and signals. The first signal was formed only in the middle of the US trading session when the pair rebounded from the level of 1.2502 with a 3-pip error. What is more, the signal turned out to be false. After its formation, the pair went up by only 13 pips, which was not enough even to set a Stop Loss to breakeven. Almost immediately, the price returned to the 1.2502 level and bounced off it again. So, if you had opened a buy trade before, it should have remained open. However, it could be closed manually already in an hour as it was getting late and there is usually no strong movement in the evening.
Trading tips on Tuesday:
On the 30-minute time frame, the downtrend is still in place. The pound has recently depreciated by 600 points, with only one day of correction after that. Therefore, the fall of the British currency can resume and continue at any time. On the 5-minute chart on Tuesday, it is recommended to trade at the levels of 1.2409, 1.2477, 1.2502, 1.2601, 1.2674, and 1.2697. Set a Stop Loss to breakeven as soon as the price passes 20 pips in the right direction after the trade is opened. Tomorrow, the UK will publish the business activity index in the manufacturing sector for April. It is unlikely to have any influence on the trajectory of the pair. In the US, the economic calendar is mostly uneventful. Therefore, we will have to rely entirely on technical analysis.
Basic rules of the trading system:
1) The strength of the signal is determined by the time it took the signal to form (a rebound or a breakout of the level). The quicker it is formed, the stronger the signal is.
2) If two or more positions were opened near a certain level based on a false signal (which did not trigger a Take Profit or test the nearest target level), then all subsequent signals at this level should be ignored.
3) When trading flat, a pair can form multiple false signals or not form them at all. In any case, it is better to stop trading at the first sign of a flat movement.
4) Trades should be opened in the period between the start of the European session and the middle of the US trading hours, when all positions must be closed manually.
5) You can trade using signals from the MACD indicator on the 30-minute time frame only amid strong volatility and a clear trend that should be confirmed by a trendline or a trend channel.
6) If two levels are located too close to each other (from 5 to 15 pips), they should be considered support and resistance levels.
On the chart:
Support and Resistance Levels are the levels that serve as targets when buying or selling the pair. You can place Take Profit near these levels.
Red lines are channels or trend lines that display the current trend and show in which direction it is better to trade now.
The MACD indicator (14, 22, and 3) consists of a histogram and a signal line. When they cross, this is a signal to enter the market. It is recommended to use this indicator in combination with trend patterns (channels and trendlines).
Important announcements and economic reports that can be found on the economic calendar can seriously influence the trajectory of a currency pair. Therefore, at the time of their release, we recommend trading as carefully as possible or exiting the market in order to avoid sharp price fluctuations.
Beginners on Forex should remember that not every single trade has to be profitable. The development of a clear strategy and money management is the key to success in trading over a long period of time.


