


Analysis of previous deals:
30M chart of the EUR/USD pair
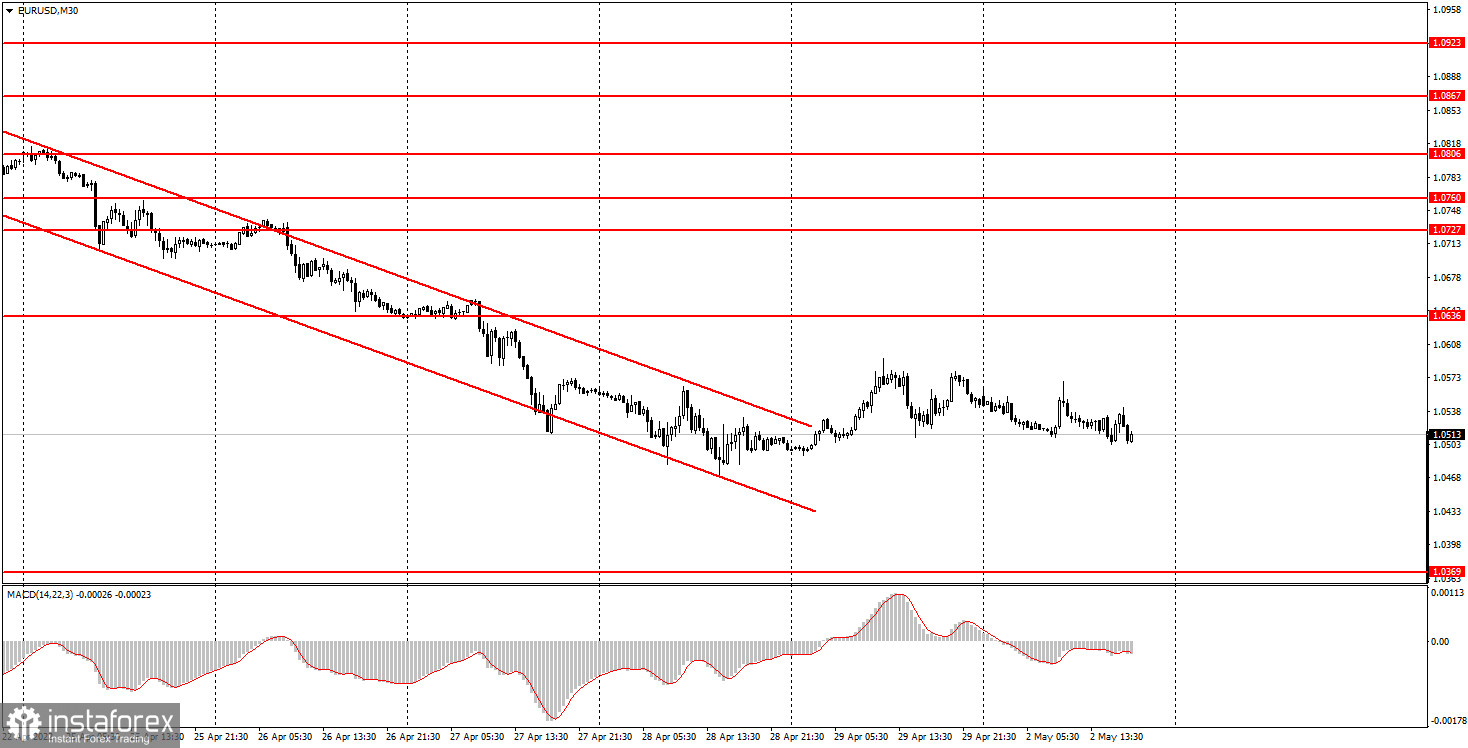
The EUR/USD currency pair moved very sluggishly and reluctantly on Monday, which even looked a little strange after a crazy previous week, during which the European currency fell by 450 points. However, there were no important events on Monday, and traders had no desire to trade. Indices of business activity in the manufacturing sectors of the US and the EU did not have any impact on the movement of the euro/dollar, as we expected yesterday. Thus, not too high volatility is understandable. However, it still amounted to 70 points, which is an average value for the euro, and the pair itself was still inclined to fall during the day. Last Friday the price corrected slightly upwards, and at the beginning of a new week the market showed that it is ready for new short positions on the euro, and not for the continuation of the correction. In general, the situation for the euro remains as difficult as possible, and hopes for a corrective movement are dispelled at the very beginning of the week.
5M chart of the EUR/USD pair
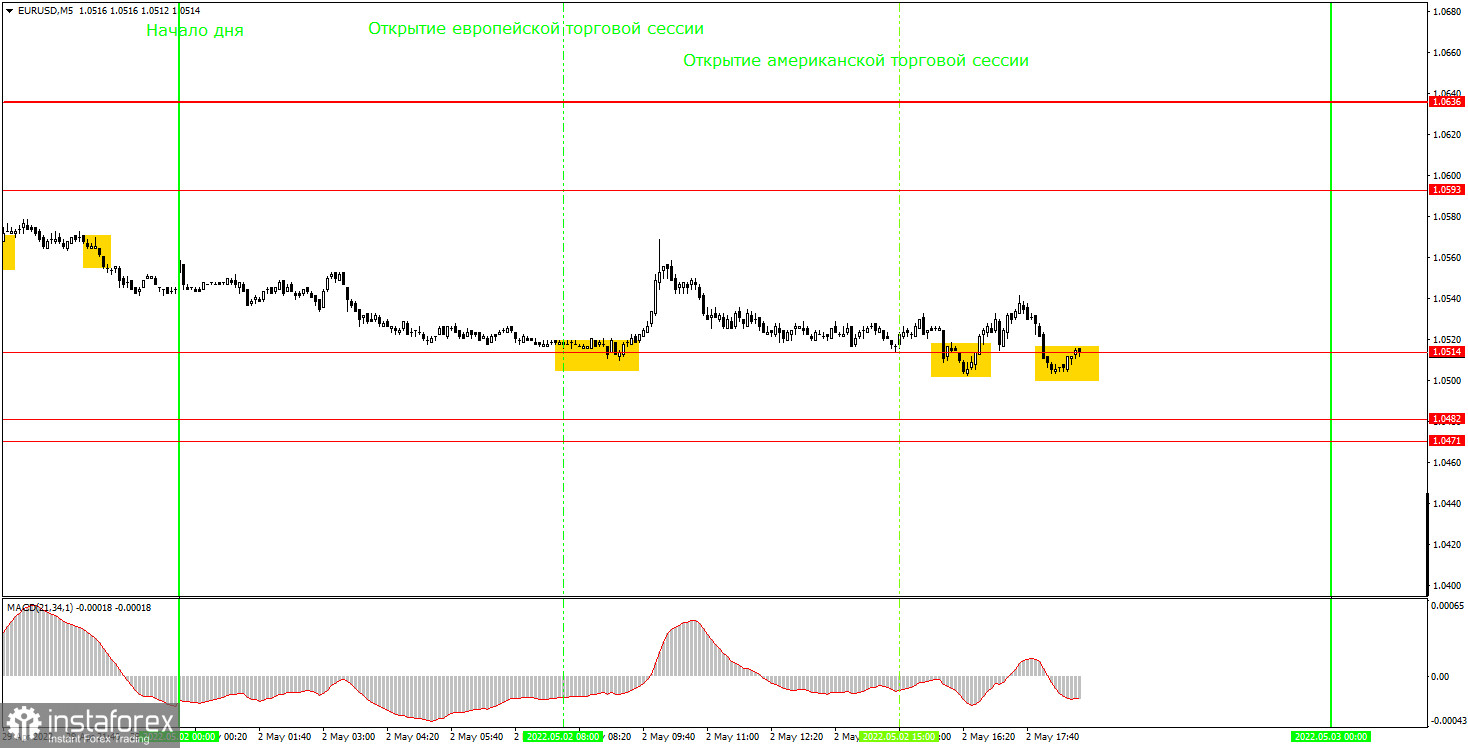
The technical picture looks appropriate. Several trading signals were generated during the day, but none of them made a profit. Although, theoretically, the first buy signal could do it. The rebound from the 1.0514 level was almost perfect in terms of accuracy, so novice traders should practice it with long positions. The pair went up at least 40 points after the signal was formed, so there was plenty of time to close the deal in profit manually. However, the 1.0593 level was still located on top and traders had every right to expect it to work out during the day. But it didn't work out, and the pair returned to the 1.0514 level. This time the price had already overcome this level, but the sell signal turned out to be false – the downward movement did not continue and the quotes quickly returned to the area above the 1.0514 level. After these two signals, all subsequent ones near the 1.0514 level should have been ignored.
How to trade on Tuesday:
The trend remains downward on the 30-minute timeframe even though the price leaves the downward channel. Monday was in a weak downward trend, which may persist throughout the current week. It is still very difficult for the euro to show growth, and there are simply no clear growth drivers. On the 5-minute TF tomorrow it is recommended to trade at the levels of 1.0369, 1.0471-1.0482, 1.0514, 1.0593, 1.0636, 1.0697. When passing 15 points in the right direction, you should set Stop Loss to breakeven. The European Union will publish data on unemployment on Tuesday and European Central Bank President Christine Lagarde will deliver a speech. Not a single important event planned in America. Thus, novice traders may pay attention to Lagarde's speech, but the reaction of the market or its absence will depend only on whether the ECB president says something important.
Basic rules of the trading system:
1) The signal strength is calculated by the time it took to form the signal (bounce or overcome the level). The less time it took, the stronger the signal.
2) If two or more deals were opened near a certain level based on false signals (which did not trigger Take Profit or the nearest target level), then all subsequent signals from this level should be ignored.
3) In a flat, any pair can form a lot of false signals or not form them at all. But in any case, at the first signs of a flat, it is better to stop trading.
4) Trade deals are opened in the time period between the beginning of the European session and until the middle of the American one, when all deals must be closed manually.
5) On the 30-minute TF, using signals from the MACD indicator, you can trade only if there is good volatility and a trend, which is confirmed by a trend line or a trend channel.
6) If two levels are located too close to each other (from 5 to 15 points), then they should be considered as an area of support or resistance.
On the chart:
Support and Resistance Levels are the Levels that serve as targets when buying or selling the pair. You can place Take Profit near these levels.
Red lines are the channels or trend lines that display the current trend and show in which direction it is better to trade now.
The MACD indicator (14,22,3) consists of a histogram and a signal line. When they cross, this is a signal to enter the market. It is recommended to use this indicator in combination with trend lines (channels and trend lines).
Important speeches and reports (always contained in the news calendar) can greatly influence the movement of a currency pair. Therefore, during their exit, it is recommended to trade as carefully as possible or exit the market in order to avoid a sharp price reversal against the previous movement.
Beginners on Forex should remember that not every single trade has to be profitable. The development of a clear strategy and money management are the key to success in trading over a long period of time.


