


Analysis of transactions of the environment:
30M chart of the GBP/USD pair.
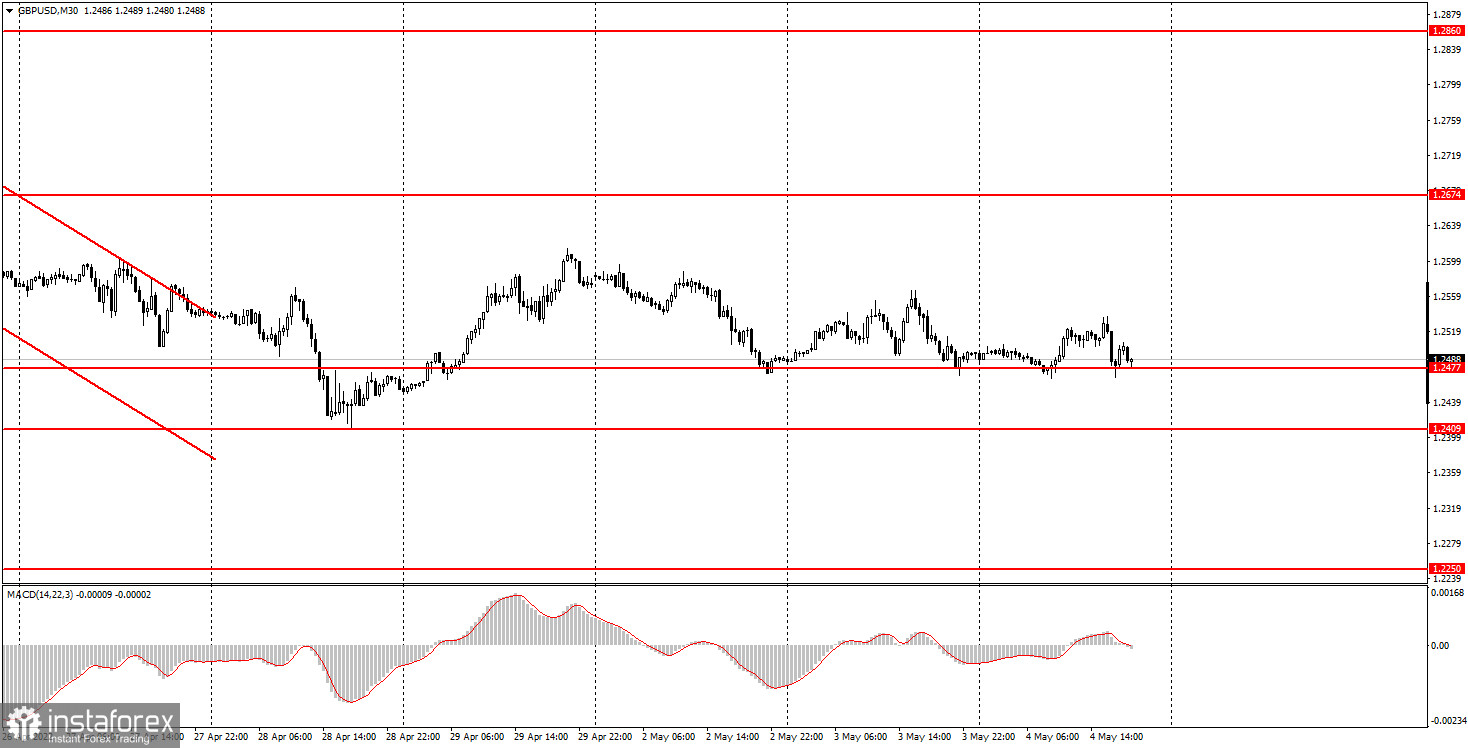
The GBP/USD pair was also trading very simply on Wednesday. The price spent the whole day near the level of 1.2477, without moving far from it. The movement of the medium can be safely called a flat. Thus, there was no trend movement, which always complicates the trading process. During the day, not a single important report was published in the UK, and US macroeconomic statistics had virtually no effect on the pair's movement. It also failed to respond to reports today. The volatility is currently about 70 points. It is quite difficult to predict what will happen in an hour since the movement can be strong and multidirectional. The results of the Fed meeting always provoke an increase in volatility, but much will depend on whether the forecasts coincide with the actual decisions that were made at the meeting and will be announced. In general, the downward trend remains for the pound, as the pound continues to trade near its 2-year lows. The pair could not even adjust normally on those days that were very suitable for this since there were no important news and events.
5M chart of the GBP/USD pair.
There were plenty of trading signals generated in the 5-minute timeframe today. However, almost all of them were formed in a flat. Although the levels of 1.2477 and 1.2502 are at a distance of 25 points from each other, they cannot be considered an area. However, they are still very close to each other, so it was difficult to work out the signals that formed between them. The first buy signal was formed when there was a rebound from the 1.2477 level. After its formation, the pair overcame the level of 1.2502 and bounced off it from above twice more. In total, 50 points were passed up, so novice traders could have time to close the deal in profit since there were few chances of reaching the target level of 1.2596 - it was located too far away. Then a sell signal was formed when the price dropped below the level of 1.2502. This is followed by a buy signal near the level of 1.2477, and then another sell signal near the level of 1.2502. According to these trading deals, it was possible to earn 5 points on each, since the levels are located too close to each other.How to trade on Thursday:
On the 30-minute TF, the downward trend persists. The pound has fallen in price by 600 points recently and showed only a very small correction after that. Therefore, the fall of the British currency may resume/continue at any moment. But, as already mentioned, conclusions should be made no earlier than tomorrow evening, especially since on Thursday there will also be a meeting of the Bank of England, which may provoke new spikes in volatility. On the 5-minute TF tomorrow, it is recommended to trade by levels 1.2409, 1.2477, 1.2502, 1.2596-1.2601, 1.2674. When the price passes after opening a deal in the right direction, 20 points should be set to Stop Loss at breakeven. The announcement of the results of the meeting of the British Central Bank is scheduled for tomorrow in the UK. The market expects that the rate will be raised by 0.25%, which, in theory, should provoke a rise in the pound. But, as in the case of the Fed, we wouldn't be so sure about this move. Andrew Bailey's speech may also have an impact on the movement of the pound/dollar pair.
Basic rules of the trading system:
1) The strength of the signal is calculated by the time it took to generate the signal (rebound or overcoming the level). The less time it took, the stronger the signal.
2) If two or more trades were opened near a certain level on false signals, then all subsequent signals from this level should be ignored.
3) In a flat, any pair can form a lot of false signals or not form them at all. But in any case, at the first signs of a flat, it is better to stop trading.
4) Trade deals are opened in the period between the beginning of the European session and the middle of the American session when all transactions must be closed manually.
5) On a 30-minute TF, signals from the MACD indicator can be traded only if there is good volatility and a trend, which is confirmed by a trend line or a trend channel.
6) If two levels are located too close to each other (from 5 to 15 points), then they should be considered as a support or resistance area.
What's on the chart:
Price support and resistance levels - the levels that are the targets when opening purchases or sales. Take Profit levels can be placed near them.
Red lines - channels or trend lines that display the current trend and show in which direction it is preferable to trade now.
MACD indicator (14,22,3) is a histogram and a signal line - an auxiliary indicator that can also be used as a signal source.
Important speeches and reports (always contained in the news calendar) can greatly influence the movement of a currency pair. Therefore, during their exit, it is recommended to trade as carefully as possible or exit the market to avoid a sharp price reversal against the previous movement.
Forex beginners should remember that every trade cannot be profitable. The development of a clear strategy and money management are the keys to success in trading over a long period.


