


Analysis of transactions of the environment:
30M chart of the EUR/USD pair.
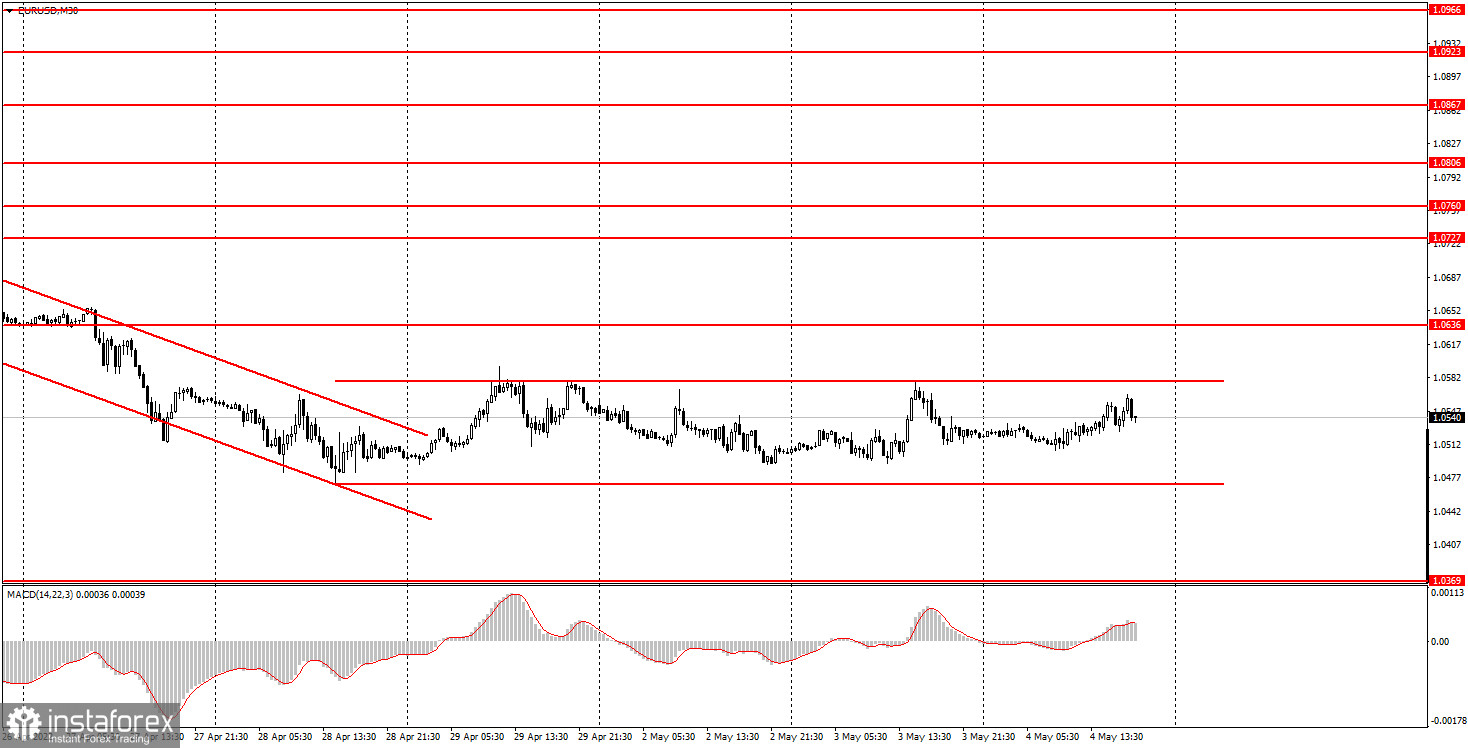
The EUR/USD currency pair continued trading inside the side channel shown in the illustration on Wednesday. Thus, by and large, it makes no sense to analyze the technical picture now. In a couple of hours, the results of the Fed meeting will be announced, after which a volatile movement is expected, the direction of which is impossible to predict now. The market expects that the rate will be raised immediately by 0.5% and, in theory, such a tightening of monetary policy should strengthen the US currency. However, it should also be taken into account that the market has been confident in this decision of the Fed for several weeks, so it will not come as a surprise. This means that it can already be incorporated into the current exchange rate of the pair. Thus, it will probably be just a volatile versatile movement. One way or another, novice traders will have to leave the market by this time. It will be better to analyze the Fed's decisions and further movements of the pair tomorrow evening when the market situation settles down a little. After all, strong movements are also possible tomorrow morning, when European traders will work out the Fed's decisions. You should also pay attention to the press conference with Jerome Powell, at which interesting information may sound.
5M chart of the EUR/USD pair.
In a 5-minute timeframe, the technical picture looks like nothing. During the day, the pair did not approach any level, so not a single trading signal was formed. Almost all day there was a flat even on the youngest TF, although there was still a minimal upward slope. However, it doesn't mean anything - the movement was weak. During the day, there were interesting publications both in the USA and in the European Union. For example, it became known that retail sales in the EU fell by 0.4% in March. The number of employees in the US private sector increased by 247 thousand, which is worse than forecast. And the US ISM services business activity index fell from 58.3 points to 57.1. Perhaps the US dollar has experienced a slight market pressure due to American statistics, but again it does not mean anything, since not a single trading signal has been formed.
How to trade on Thursday:
On the 30-minute timeframe, the trend remains downward, despite the exit of the price from the descending channel and the sideways formed. The situation may change dramatically tonight, as a highly volatile movement is expected. However, even leaving the channel through any border will not mean that now a new trend will be formed in this direction. That is why we say that the technical picture will need to be analyzed tomorrow evening. On the 5-minute TF tomorrow, it is recommended to trade by levels 1.0369, 1.0471-1.0490, 1.0578-1.0593, 1.0636, and 1.0697. When passing 15 points in the right direction, you should set the Stop Loss to breakeven. No important events or reports are scheduled for Thursday either in America or the European Union. Nevertheless, volatility has been quite high in recent weeks and it may also be so tomorrow, as the market may continue to work out the results of the Fed meeting and Jerome Powell's speech.
Basic rules of the trading system:
1) The strength of the signal is calculated by the time it took to generate the signal (rebound or overcoming the level). The less time it took, the stronger the signal.
2) If two or more trades were opened near a certain level on false signals, then all subsequent signals from this level should be ignored.
3) In a flat, any pair can form a lot of false signals or not form them at all. But in any case, at the first signs of a flat, it is better to stop trading.
4) Trade deals are opened in the period between the beginning of the European session and the middle of the American session when all transactions must be closed manually.
5) On a 30-minute TF, signals from the MACD indicator can be traded only if there is good volatility and a trend, which is confirmed by a trend line or a trend channel.
6) If two levels are located too close to each other (from 5 to 15 points), then they should be considered as a support or resistance area.
What's on the charts:
Price support and resistance levels - target levels when opening purchases or sales. Take Profit levels can be placed near them.
Red lines - channels or trend lines that display the current trend and show in which direction it is preferable to trade now.
MACD indicator (14,22,3) is a histogram and a signal line - an auxiliary indicator that can also be used as a signal source.
Important speeches and reports (always contained in the news calendar) can greatly influence the movement of a currency pair. Therefore, during their exit, it is recommended to trade as carefully as possible or exit the market to avoid a sharp price reversal against the previous movement.
Forex beginners should remember that every trade cannot be profitable. The development of a clear strategy and money management are the keys to success in trading over a long period.


