EUR/USD 5M

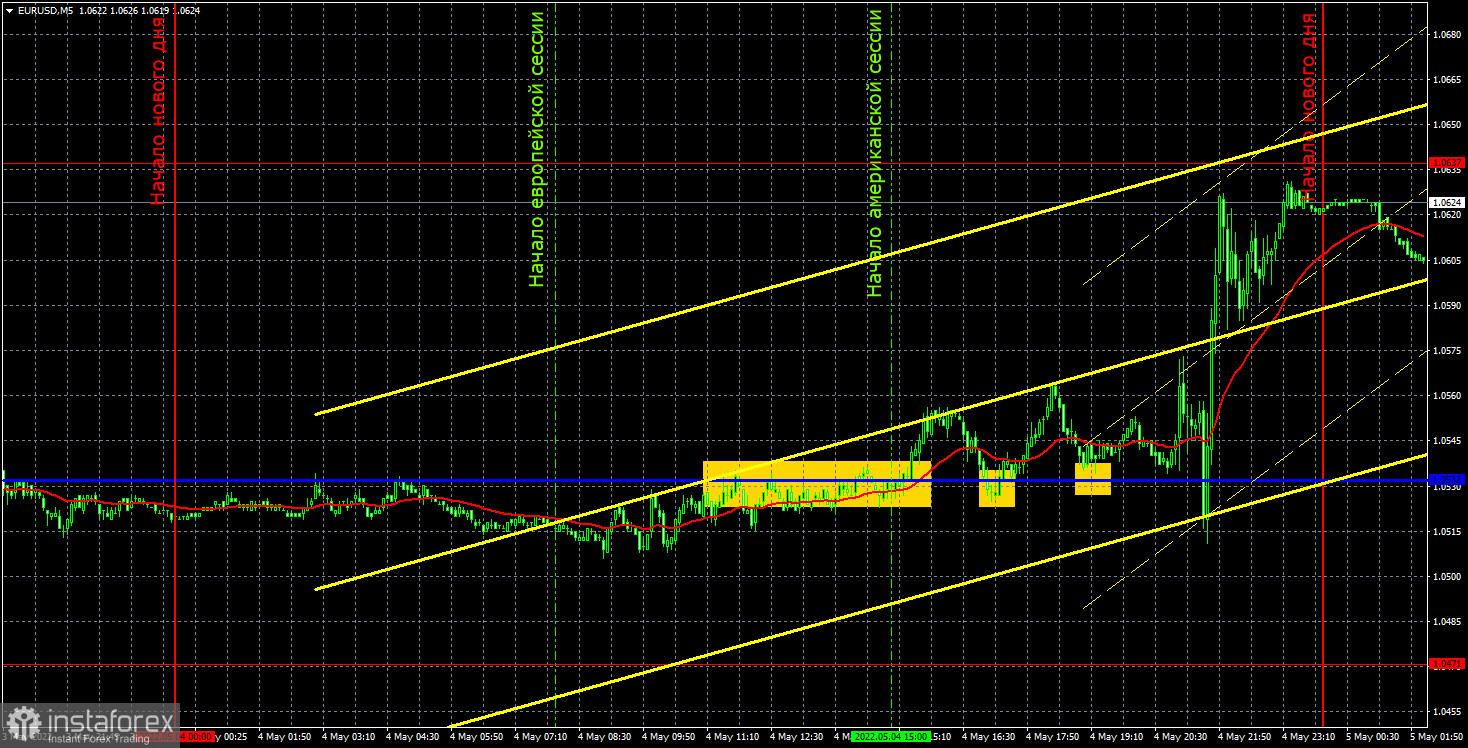
The EUR/USD pair was trading almost flat on Wednesday. There was a slight upward bias, and also pretty good volatility. However, the volatility in recent weeks and even months is no surprise. The market is trading quite actively now, so 80 points a day is the norm. We do not consider the pair's movements that happened after the results of the Federal Reserve meeting were announced. We have already said that it will be necessary to sum up and evaluate the technical picture no earlier than tonight, since traders will also work out this event at the European and Asian trading sessions. Therefore, we consider only movements BEFORE the results of the Fed meeting. There were interesting reports both in the European Union and in the US, but they had no effect on the pair's movement. Even the relatively important ADP and ISM reports in the US, which turned out to be worse than expected in general. The dollar fell during the day, but this decline is difficult to link with macroeconomic statistics. The reports and the dollar's decline did not coincide in time.
There were few trading signals on Wednesday, and all of them were extremely inaccurate. For example, the first trading signal, which formed around 5 o'clock, has already made it clear what the movement will be during the day. It is unlikely that it should have been worked out, since the price could not decide what to do near the Kijun-sen line. The next two buy signals were more interesting, but each time the pair went up no more than 25 points. This was enough to set Stop Loss to breakeven, but no more. One should not have traded during the announcement of the results of the Fed meeting.
COT report:

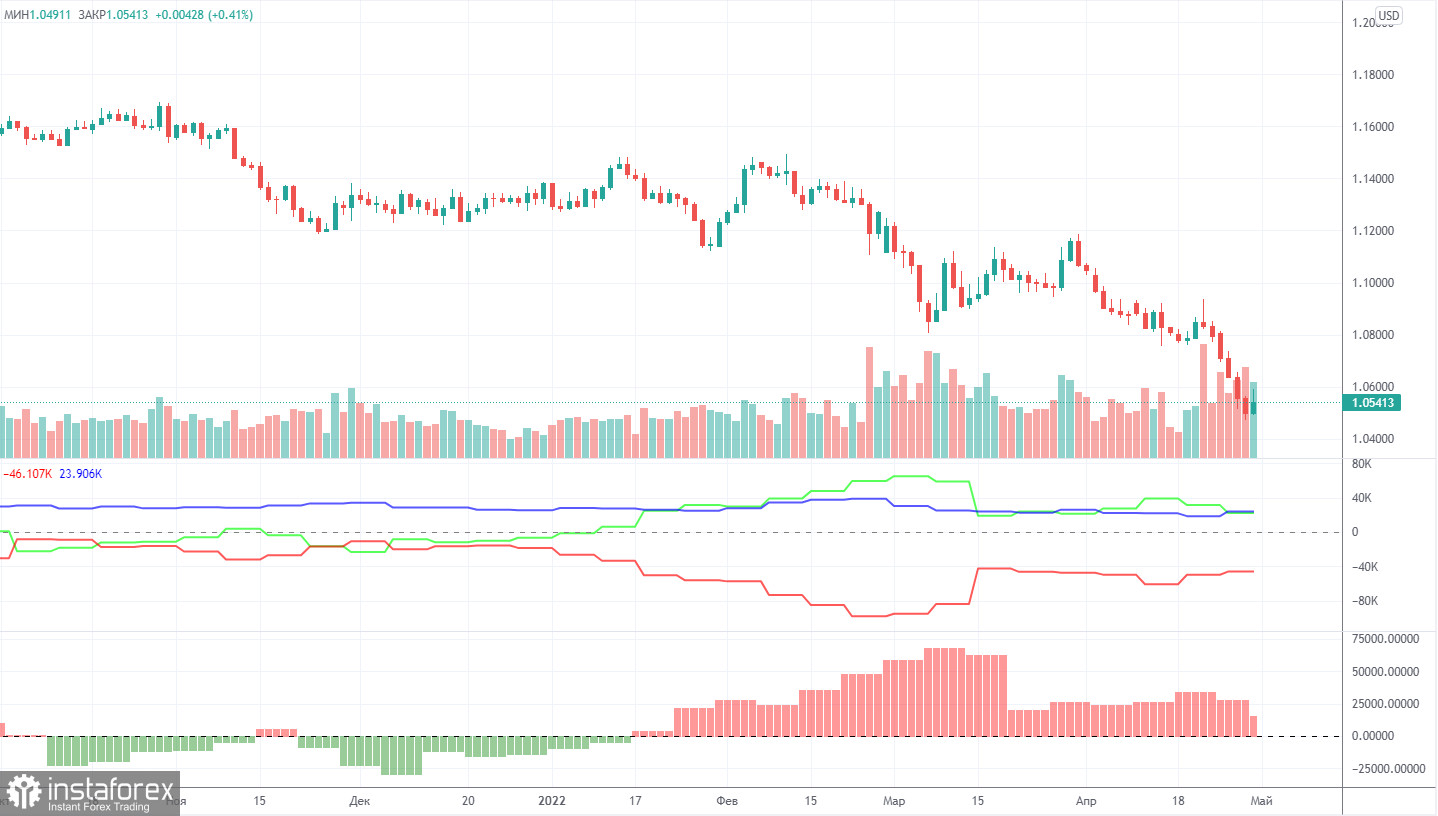
The latest Commitment of Traders (COT) reports on the euro raised more questions than they answered! Major players, starting from January 2022, maintain a bullish mood, and the euro currency, starting from January 2022, maintains a downward trend. During this time, it has already fallen in price by almost 10 cents, however, all this time the mood remained bullish. During the reporting week, the number of long positions increased by 2,000, while the number of shorts in the non-commercial group increased by 11,000. Thus, the net position decreased by 9,000 contracts. This means that the bullish sentiment has eased, but it is still bullish, as the number of long positions now exceeds the number of short positions held by non-commercial traders by 22,000. Accordingly, the paradox remains and it lies in the fact that professional players generally buy more euros than they sell, while the euro continues to fall almost non-stop, which is clearly seen in the chart above. We explained earlier that this effect is achieved by higher demand for the US dollar (there are simply no other options). The demand for the dollar is higher than the demand for the euro, so the dollar is growing in tandem with the euro. Therefore, the data of COT reports on the euro now does not make it possible to predict the further movement of the pair. The longer the phase of active hostilities in Ukraine lasts, the higher the likelihood of serious consequences of the food and energy crises for the European Union, and the dollar may continue to grow due to its status as a "reserve" currency and the stability of the American economy.
We recommend to familiarize yourself with:
Overview of the EUR/USD pair. May 5. The European Union is preparing an oil embargo, but Europe is not sure about the effectiveness of this measure.
Overview of the GBP/USD pair. May 5. The UK is heading for nuclear power.
Forecast and trading signals for GBP/USD on May 5. Detailed analysis of the movement of the pair and trading transactions.
EUR/USD 1H

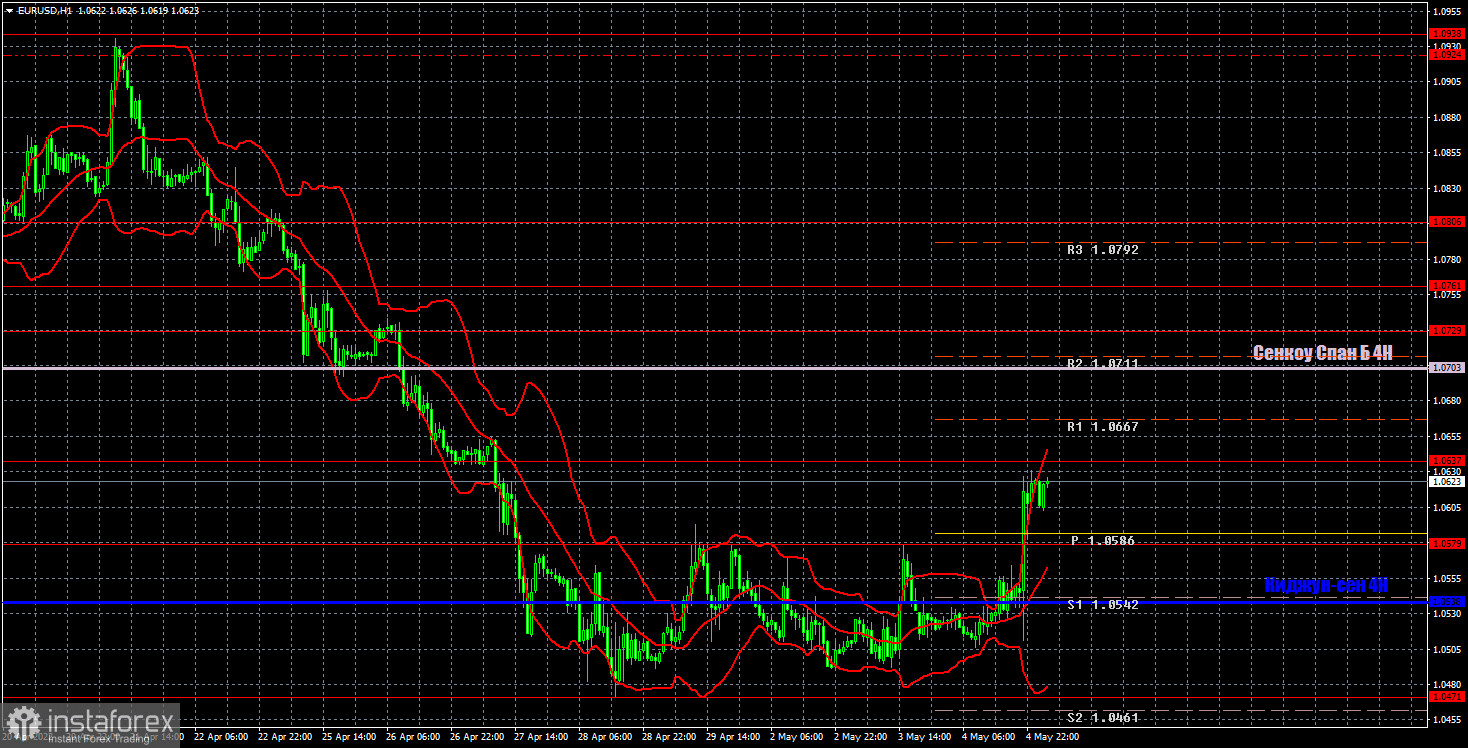
You can clearly see on the hourly timeframe that the pair was trading sideways yesterday and in the last few days too. It will be necessary to re-evaluate the technical picture after the market calms down after the Fed meeting. At the moment, we cannot conclude which border of the horizontal channel (1.0471-1.0579) the pair will use to exit, the movement will continue in that direction. We highlight the following levels for trading on Thursday - 1.0340-1.0369, 1.0471, 1.0579, 1.0637, 1.0729, as well as Senkou Span B (1.0703) and Kijun-sen (1 .0538). Ichimoku indicator lines can move during the day, which should be taken into account when determining trading signals. There are also secondary support and resistance levels, but no signals are formed near them. Signals can be "rebounds" and "breakthrough" extreme levels and lines. Do not forget about placing a Stop Loss order at breakeven if the price has gone in the right direction for 15 points. This will protect you against possible losses if the signal turns out to be false. No important events or reports scheduled for May 5 in the European Union and the United States. However, there may still be a volatile movement during the day, as the markets will continue to work out the results of the Fed meeting.
Explanations for the chart:
Support and Resistance Levels are the levels that serve as targets when buying or selling the pair. You can place Take Profit near these levels.
Kijun-sen and Senkou Span B lines are lines of the Ichimoku indicator transferred to the hourly timeframe from the 4-hour one.
Support and resistance areas are areas from which the price has repeatedly rebounded off.
Yellow lines are trend lines, trend channels and any other technical patterns.
Indicator 1 on the COT charts is the size of the net position of each category of traders.
Indicator 2 on the COT charts is the size of the net position for the non-commercial group.


