


Yesterday, traders received many signals that led to profit. Let us take a look at the 5-minute chart to find out what really happened. Earlier, I asked you to pay attention to the level of 1.0526 to decide when to enter the market. The euro showed an unsuccessful attempt to rise after quite a strong report on the eurozone services PMI. This led to a false break of 1.0526 and sell signal. However, I did not see a massive sell-off since most traders decided to take the wait-and-see approach before the Fed's meeting. Close to midday, bulls managed to consolidate above 1.0526. A downward test of this level caused a buy signal. As a result, the pair increased by 30 pips. At the beginning of the US trade, bulls protected the level of 1.0526. Then, we saw a downward test of this level, which caused a buy signal and allowed the pair to climb by 40 pips.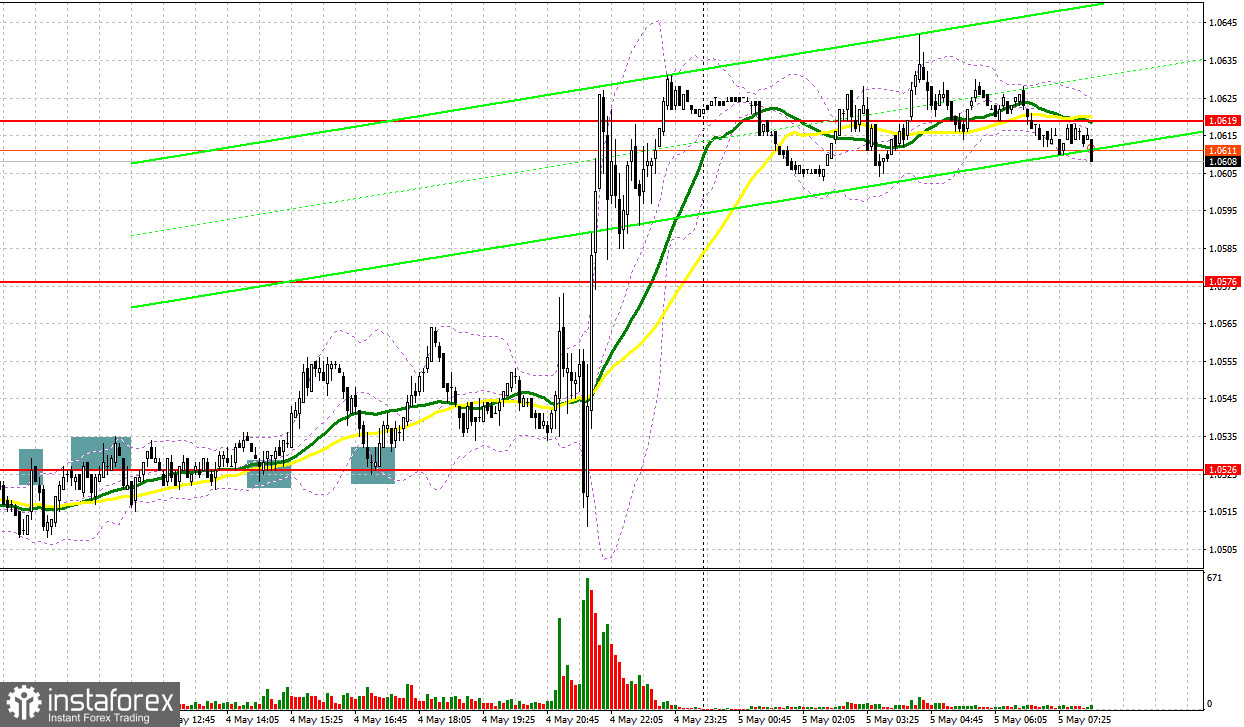
Conditions for opening long positions on EUR/USD:
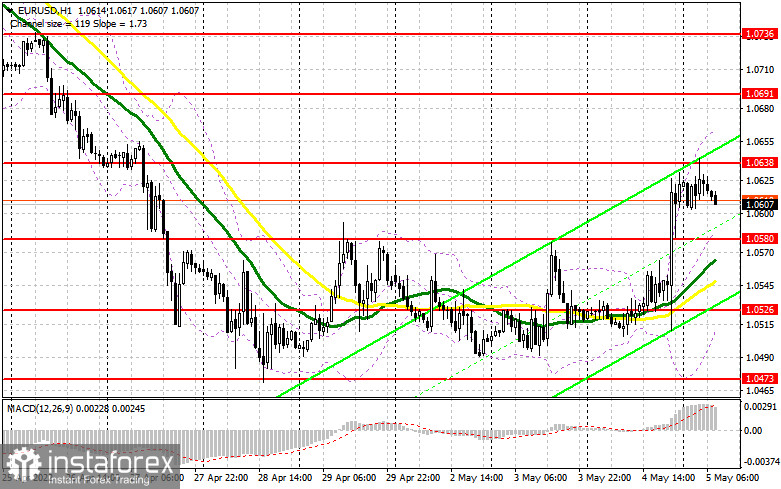
Yesterday, the US Fed raised the benchmark rate by 0.5% and took a more gradual approach to its balance reduction. Such steps could be considered clear signals that no one will do their best to cope with surging inflation. The Fed's Chair said that the regulator would hardly raise the key interest rate by 0.75%. At the next two meetings, the interest rates will be raised by 0.5% as planned earlier. Against the backdrop, the US dollar fell, thus allowing the euro to rise. As a result, the euro started a long-awaited correction. However, the euphoria may end soon and the euro will return under pressure. That is why today, buyers should primarily protect the first support level of 1.0580. Only strong data on Germany's factory orders, Italy's factor orders, and the speech of Member of the Executive Board of the ECB Philip Lane may cause a false break of this level. Strong statistical reports may boost the price to 1.0638. A downward test of this level may lead to a long signal, allowing the pair to return to 1.0691, where it is recommended to lock in profits. A farther target is located at 1.0736. However, to reach the level, the pair should continue rising. In addition, there should be big players who will bet on the euro's rise. If the euro/dollar pair falls and buyers fail to protect 1.0580, it will be better not to open long positions. Traders should buy the euro after a false break of the new low of 1.0526. It is also possible to go long from 1.0473 or lower – from 1.0126, expecting an increase of 30-35 pips.
Conditions for opening short positions on EUR/USD:
Sellers lost control over the market, but it is too early to talk about a change in the market sentiment. Today, sellers should protect the nearest resistance level of 1.0638. It will be wise to open short positions after a false break of this level. Weak data from Germany and Italy will also prove the signal. In this case, the pair may decline to 1.0580. If the eurozone publishes weak figures, in the first part of the day, the pair is likely to settle below 1.0580. An upward test of this level will give a perfect sell signal, thus allowing bears to regain control over the market and push the price to 1.0526, where it is recommended to lock in profits. A farther target is located at 1.0473. However, this scenario will become possible only in case of buyers' failure. If the euro/dollar pair rises and bears fail to protect 1.0638, they may face significant problems. In this case, the euro may surge. Thus, it will be better to open short positions after a false break of 1.0691. It is also possible to sell the euro from 1.0736 or higher – from 0.0775, expecting a drop of 25-30 pips.
COT report
According to the COT report from April 19, the number of short positions jumped, whereas the number of long positions dropped. The recent comments provided by representatives of central banks led to a massive sell-off of risk assets. The central banks' officials made it clear that developed economies are likely to face grave problems this year. Although the ECB president emphasizes that the regulator is planning to close its asset-purchasing program by the end of the second quarter, it is not enough to support the euro. The Fed's more aggressive policy and its intention to raise the benchmark rate by 0.75% in May are supporting the greenback. In addition, global economic slowdown could be caused by quarantine measures imposed in China to curb the new virus wave. Such actions have already led to serious disruptions in supply to European and Asian countries. Against the backdrop, demand for the US dollar remains very high, thus pushing the euro/dollar pair lower. Military actions in Ukraine are also exerting pressure on the euro. The COT report unveiled that the number of long non-commercial positions dropped to 221,003 from 221,645, while short non-commercial positions surged to 189,702 from 182,585. The decline in the euro makes it more attractive for investors. At the end of the week, the total non-commercial net position decreased to 34,055 against 39,060. The weekly closing price collapsed to 1.0814 against 1.0855.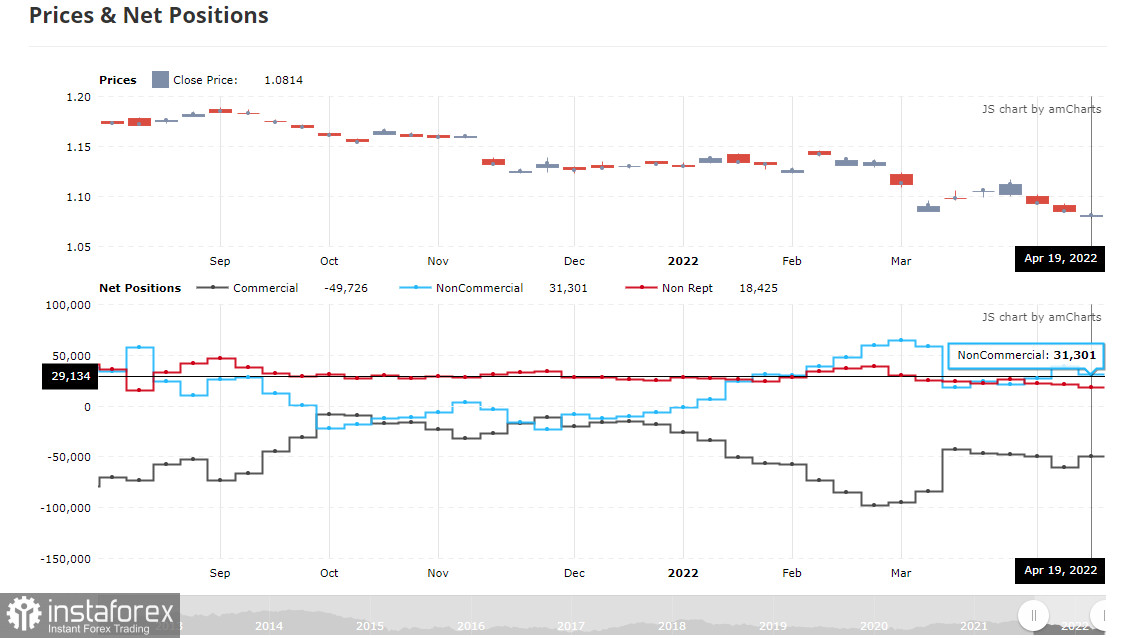
Signals of indicators:
Moving Averages
Trading is performed above 30- and 50-day moving averages, thus pointing to a new attempt to form an upward correction.
Note: The period and prices of moving averages are considered by the author on the one-hour chart that differs from the general definition of the classic daily moving averages on the daily chart.
Bollinger Bands
A break of the middle limit of the range located at 1.0580 will cause a new drop in the euro.
Description of indicators
- Moving average (moving average, determines the current trend by smoothing volatility and noise). The period is 50. It is marked in yellow on the chart.
- Moving average (moving average, determines the current trend by smoothing volatility and noise). The period is 30. It is marked in green on the graph.
- MACD indicator (Moving Average Convergence/Divergence - convergence/divergence of moving averages). A fast EMA period is 12. A slow EMA period is 26. The SMA period is 9.
- Bollinger Bands. The period is 20.
- Non-profit speculative traders are individual traders, hedge funds, and large institutions that use the futures market for speculative purposes and meet certain requirements.
- Long non-commercial positions is a total number of long positions opened by non-commercial traders.
- Short non-commercial positions is a total number of short positions opened by non-commercial traders.
- The total non-commercial net position is a difference in the number of short and long positions opened by non-commercial traders.


