


Details of the economic calendar from May 4
The US Federal Reserve increased the interest rate by 0.5% at its meeting, as expected. It is possible that, for this reason, there was no proper reaction on the market.
The main theses of the Fed:
- raised the rate by 0.5%
- a further rate increase is appropriate
- a 0.5% rate increase will be considered at the next two meetings; after that, an increase of 0.25 is likely%
- a 0.75% rate hike is not currently being actively considered
- balance sheet reduction will begin on June 1, the rate of reduction will accelerate three months after the start
- the question of a soft landing of the economy remains open
Analysis of trading charts from May 4
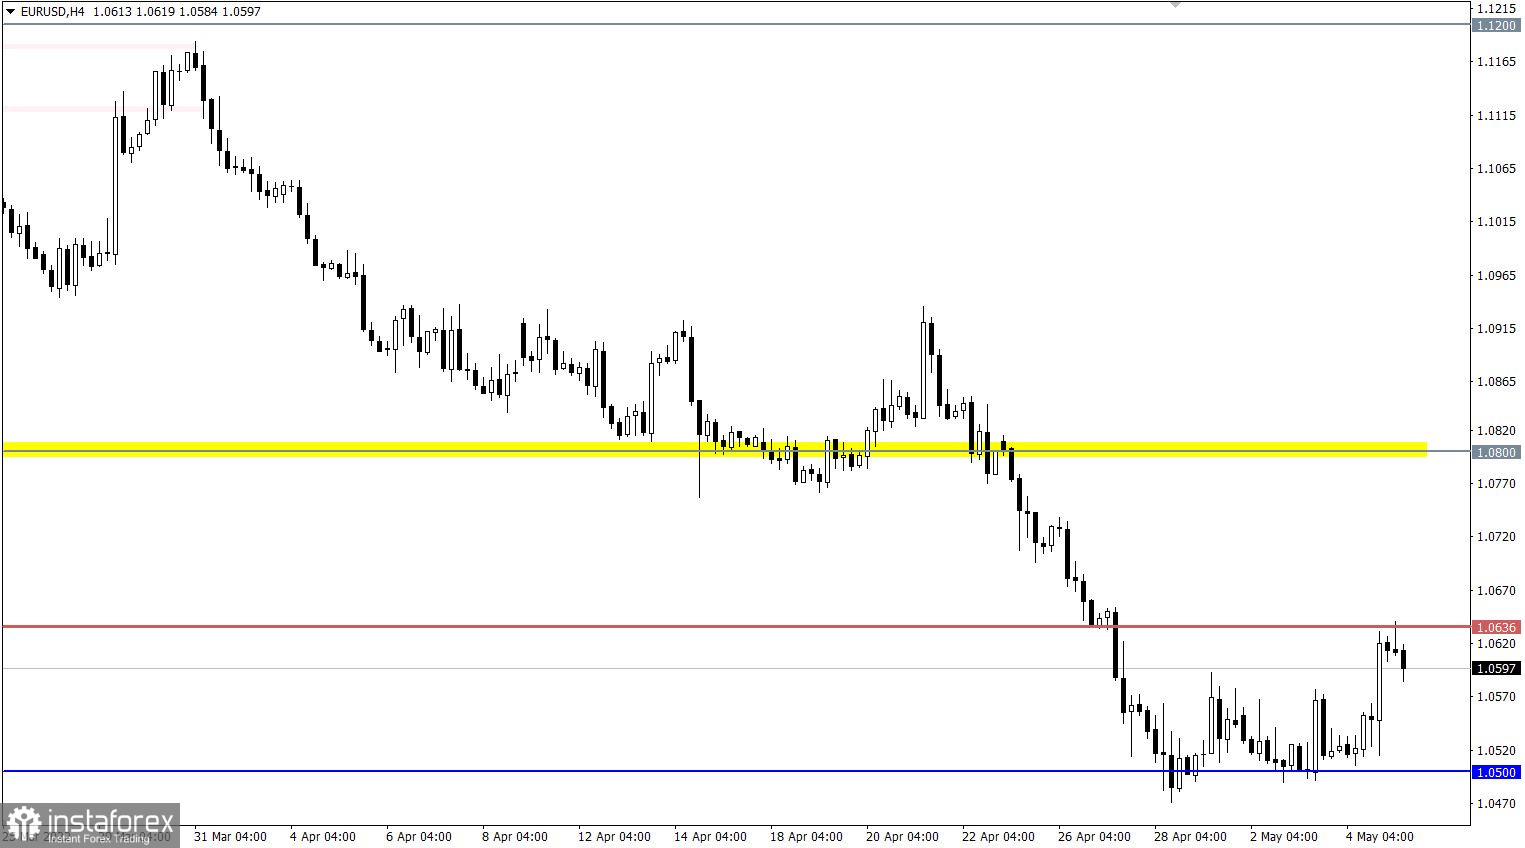
The EURUSD currency pair, after several days of stagnation within the support level of 1.0500, rebounded from it. This movement was accompanied by high speculative interest, which led to a local price jump of more than 100 points. As a result, the quote returned to the previously passed local minimum in the spring of 2020, at 1.0636.
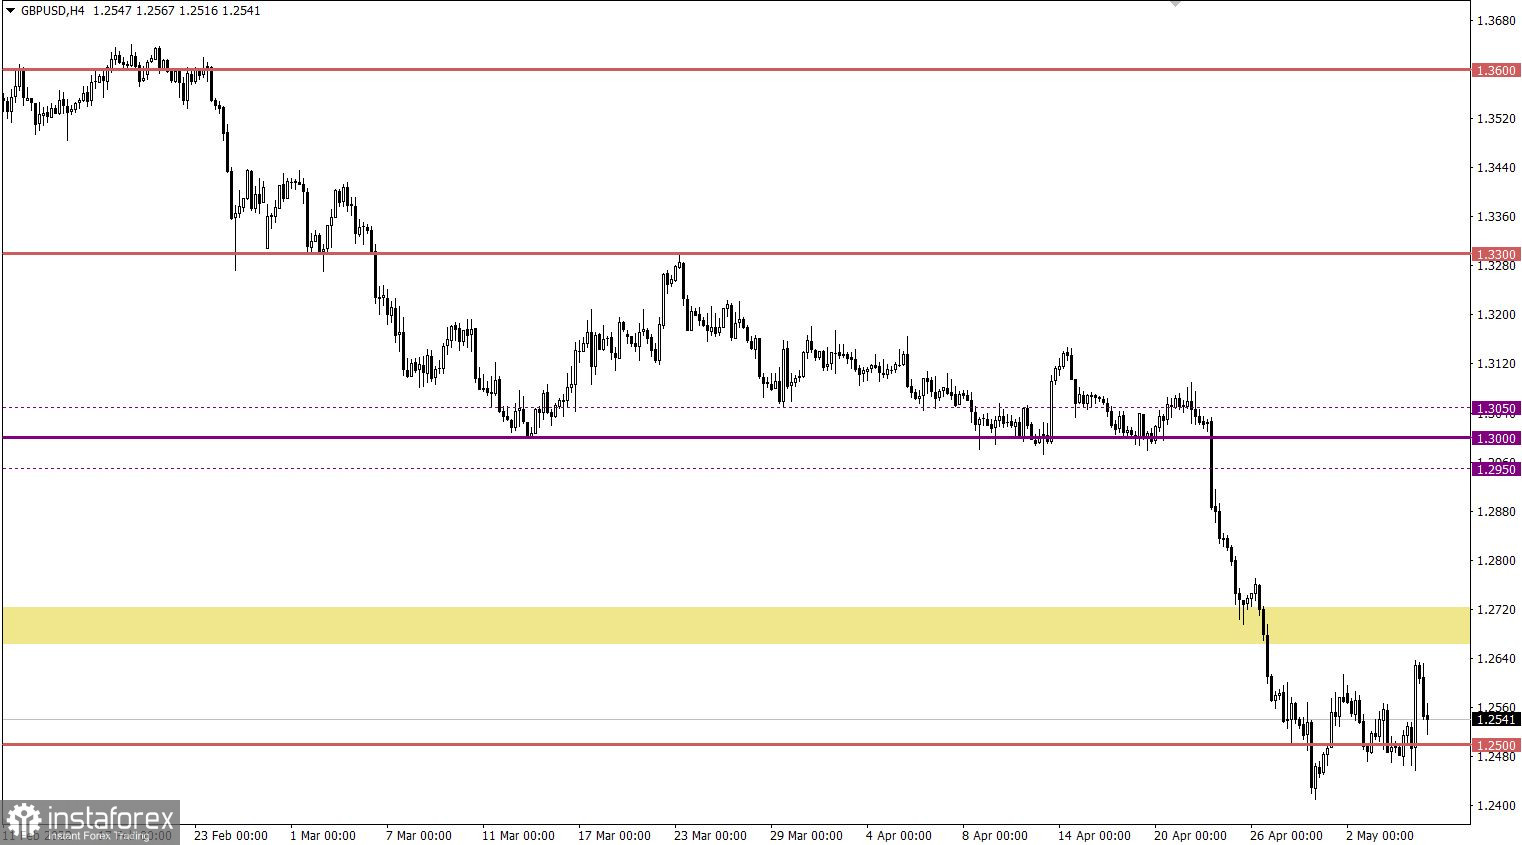
Following the market, the GBPUSD currency pair showed local upward interest, where dollar positions lost about 150 points. This movement led to a temporary change in trading interests, but not to a change in trend.

Economic calendar for May 5
Today, the focus is on the meeting of the Bank of England, where they expect the fourth consecutive increase in interest rates by 25 basis points. Annual inflation in the UK reached a 30-year high of 7% in March, so the regulator has no choice but to continue tightening monetary policy.
Will the pound sterling react to the news about the rate hike? Possible, but in a local form, in view of the fact that the event is expected in the market.
During the American trading session, data on jobless claims in the United States will be published, where figures are expected to remain unchanged. Thus, if the forecasts are confirmed, then no one will pay attention to the data on applications.
Time targeting
BoE meeting result - 11:00 UTC
US Jobless claims - 12:30 UTC
Trading plan for EUR/USD on May 5
The slowdown of the upward cycle around the value of 1.0636 led to the formation of a consolidation of versatile Doji-type candles. This threatens with new speculative manipulations in the market. For this reason, two possible scenarios should be considered at once.
The first scenario comes from the tactic of a rebound from the level of 1.0636, where holding the price below 1.0600 can restart the sellers' positions. This will cause the price to return to the support level of 1.0500.
The second scenario considers the formation of a full-length correction, where holding the price above 1.0655 can lead to a move towards 1.0700-1.0800.
Trading plan for GBP/USD on May 5
At the moment, most of the recent impulse has been won back, the quote has returned to the boundaries of the earlier amplitude movement. In order for the downward move to get a new round of activity, the quote needs to stay below 1.2450. In this case, the medium-term downward trend will again be prolonged to new price levels. Otherwise, another turbulence is possible within the values of 1.2460/1.2600, which may be facilitated by the results of the Bank of England meeting.
What is reflected in the trading charts?
A candlestick chart view is graphical rectangles of white and black light, with sticks on top and bottom. When analyzing each candle in detail, you will see its characteristics of a relative period: the opening price, closing price, and maximum and minimum prices.
Horizontal levels are price coordinates, relative to which a stop or a price reversal may occur. These levels are called support and resistance in the market.
Circles and rectangles are highlighted examples where the price of the story unfolded. This color selection indicates horizontal lines that may put pressure on the quote in the future.
The up/down arrows are the reference points of the possible price direction in the future.


