


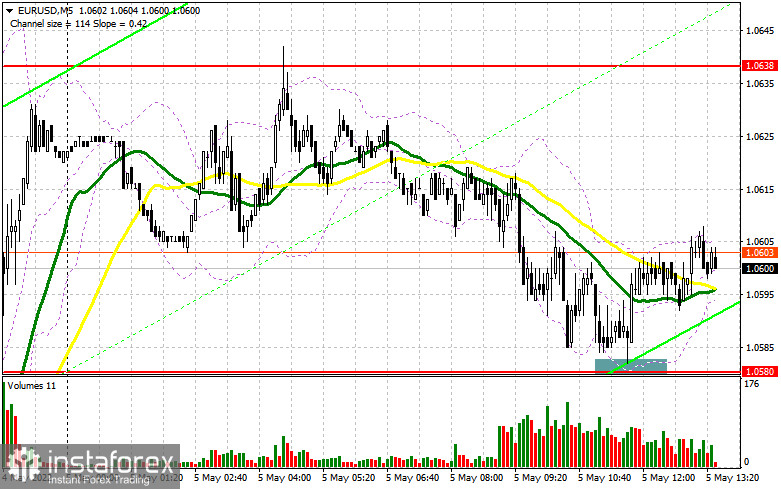
In the morning article, I highlighted the level of 1.0580 and recommended taking decisions with this level in focus. Now let's look at the 5-minute chart and try to figure out what actually happened. The projected drop to the 1.0580 area and the test of this level led to a false breakout. It signed long positions following yesterday's rally triggered by Jerome Powell's dovish comments. However, at the time of writing the article, the pair climbed by about 25 pips. After that, its growth slowed down. Negative data on industrial production of Germany and Italy cooled bullish sentiment. Yet, we can expect further growth of the pair as long as it is trading above 1.0580.
What is needed to open long positions on EUR/USD
In the second half of the day, there are no fundamental factors that could somehow stir up the euro. This is why analysts cast doubt on the further upward movement of the pair to 1.0638. Technical indicators give the same signals. Therefore, the trading strategy has remained unchanged. Speculators are awaiting the US initial jobless claims report. In case of a positive figure, the euro may return again to 1.0580. The optimal scenario for opening long positions from this level will be a false breakout amid a strong bullish bias. However, the bulls are slowly but surely losing momentum. The moving averages are passing in the positive territory just below 1.0580. It may also help the pair climb higher. If industrial data is discouraging, the pair is likely to fall to 1.0638. A breakout and a downward test of this level will give a new buy signal. It may also open the way to 1.0691 where it is recommended to lock in profits. A more distant target will be the 1.0736 level. If EUR/USD declines and bills show no activity at 1.0580, which is extremely likely, it is better to cancel long positions. I would advise you to wait for a false breakout near the low of 1.0526. Pay special attention to this range. If bulls have failed to defend this range, they will be unable to start an upward correction. It is recommended to open long positions immediately for a rebound only from 1.0473 or even a lower low around 1.0426, keeping in mind an upward intraday correction of 30-35 pips.
What is needed to open short positions on EUR/USD
The sellers are gradually returning to the market. They should protect the nearest resistance level of 1.0638. Traders need to take notice of this level in case of the rapid growth of the euro in the afternoon. The optimal scenario for opening short positions will be a false breakout of this level as well as strong US labor market data. If this scenario comes true, a sell signal will appear. It may increase pressure on the pair, pushing it down to 1.0580. Notably, the bears failed to do so in the morning. Traders refrain from opening long positions at 1.0580. A breakout and decline below 1.0580 as well as an upward test will give an excellent sell signal. If so, it could trigger a sharp drop in the bulls' stop orders. The pair may again resume the bearish trend with the prospect of sliding to 1.0526. I would recommend you to lock in profits at his level. A more distant target will be the 1.0473 level. Such a scenario may come true only after the total victory of the bears. If EUR/USD rises during the US session and bears show no energy at 1.0638, the pair may perform a sharp upward reversal. It is better to open short positions after a false of 1.0691. It is recommended to sell EUR/USD immediately on a rebound from 1.0736 or even a higher high around 1.0775, keeping in mind a downward intraday correction of 25-30 pips.
COT report
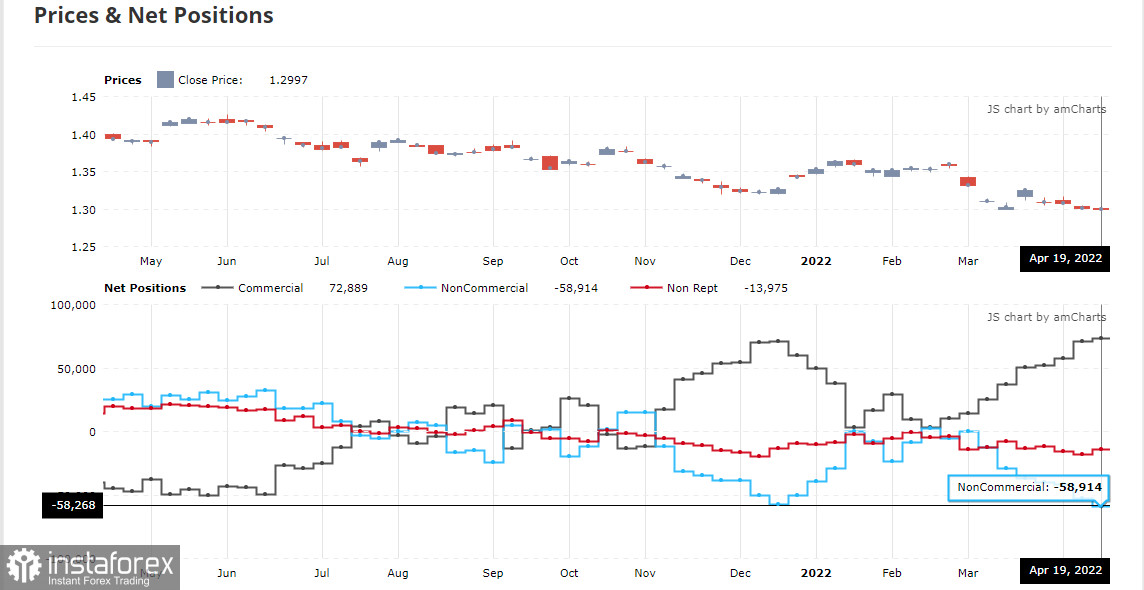
The COT report (Commitment of Traders) for April 19 logged a jump in short positions and a drop in long ones. Recent statements made by the central banks' officials have triggered a new wave of sell-off of risky assets. Market participants are now well aware that advanced economies are unlikely to escape serious economic problems this year. Although ECB President Christine Lagarde noted in her speeches that the regulator could fully complete the bond purchase program by the end of the second quarter of this year, hinting at a rate hike in early autumn, the euro was unable to regain ground. The Fed turned out to be not as hawkish as many anticipated. It slightly weakened demand for the US dollar. It also led to equilibrium in the market. Analysts are now also extremely worried about a new crisis due to strict quarantine restrictions in China against the background of the coronavirus outbreak. It has already caused supply chain disruptions in European and Asian countries. The COT report reveals that the number of long non-commercial positions decreased to 221,003 from 221,645, while the number of short non-commercial positions jumped to 189,702 from 182,585. A weaker euro is more attractive to investors. This is why a slight decline in the volume of long positions is hardly surprising. At the end of the week, the total non-commercial net position dropped to 34,055 against 39,060. The weekly closing price dipped to 1.0814 against 1.0855.
Signals of technical indicators
Moving averages
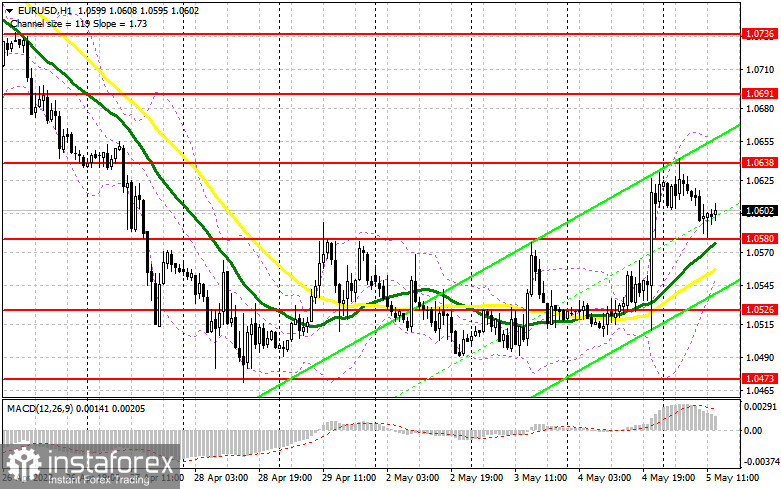
EUR/USD is trading slightly above 30- and 50-period moving averages. It means that the bulls don't give up attempts to carry on with an upward correction.
Remark. The author is analyzing the period and prices of moving averages on the 1-hour chart. So, it differs from the common definition of classic daily moving averages on the daily chart.
Bollinger Bands
In case of a rise, the upper border of 1.0650 will act as resistance. If the pair declines, the lower border of 1.0545 will act as support.
Definitions of technical indicators
- Moving average recognizes an ongoing trend through leveling out volatility and market noise. A 50-period moving average is plotted yellow on the chart.
- Moving average identifies an ongoing trend through leveling out volatility and market noise. A 30-period moving average is displayed as the green line.
- MACD indicator represents a relationship between two moving averages that is a ratio of Moving Average Convergence/Divergence. The MACD is calculated by subtracting the 26-period Exponential Moving Average (EMA) from the 12-period EMA. A 9-day EMA of the MACD called the "signal line".
- Bollinger Bands is a momentum indicator. The upper and lower bands are typically 2 standard deviations +/- from a 20-day simple moving average.
- Non-commercial traders - speculators such as retail traders, hedge funds, and large institutions who use the futures market for speculative purposes and meet certain requirements.
- Non-commercial long positions represent the total long open position of non-commercial traders.
- Non-commercial short positions represent the total short open position of non-commercial traders.
- The overall non-commercial net position balance is the difference between short and long positions of non-commercial traders.


