


Details of the economic calendar from May 5
The Bank of England raised interest rates by 25 basis points for the fourth time in a row, to 1%, reaching the highest level since the beginning of 2009.
The main theses of the Bank of England:
- The Bank of England lowered its forecast for UK GDP growth in 2023 to 0.25% from 1.25%, and in 2024 to 0.25% from 1%.
- The Bank of England raised its 2022 inflation forecast to 10.25% from 5.75%.
- The Bank of England raised the inflation forecast in 2023 to 3.5% from 2.5%; the forecast for 2024 was lowered to 1.5% from 1.75%.
- The Bank of England left the forecast for UK GDP growth in 2022 at 3.75%.
- Bank of England: disposable household income to fall by 1.75% in 2022.
- Bank of England: energy bills to rise another 40% in October.
- The Bank of England expects the key rate to rise to 2.5% by mid-2023.
What was the reaction of the market to the results of the meeting of the Bank of England?
The rate increase by 0.25% was expected, so traders were in no hurry to react to this news. Inflation continues to rise, which is detrimental to the economy. The main stimulus for the decline in the pound and the growth in the volume of dollar positions was the large-scale withdrawal of investors from risk. This is clearly seen in the stock indices, which were actively declining during the past day.
Analysis of trading charts from May 5
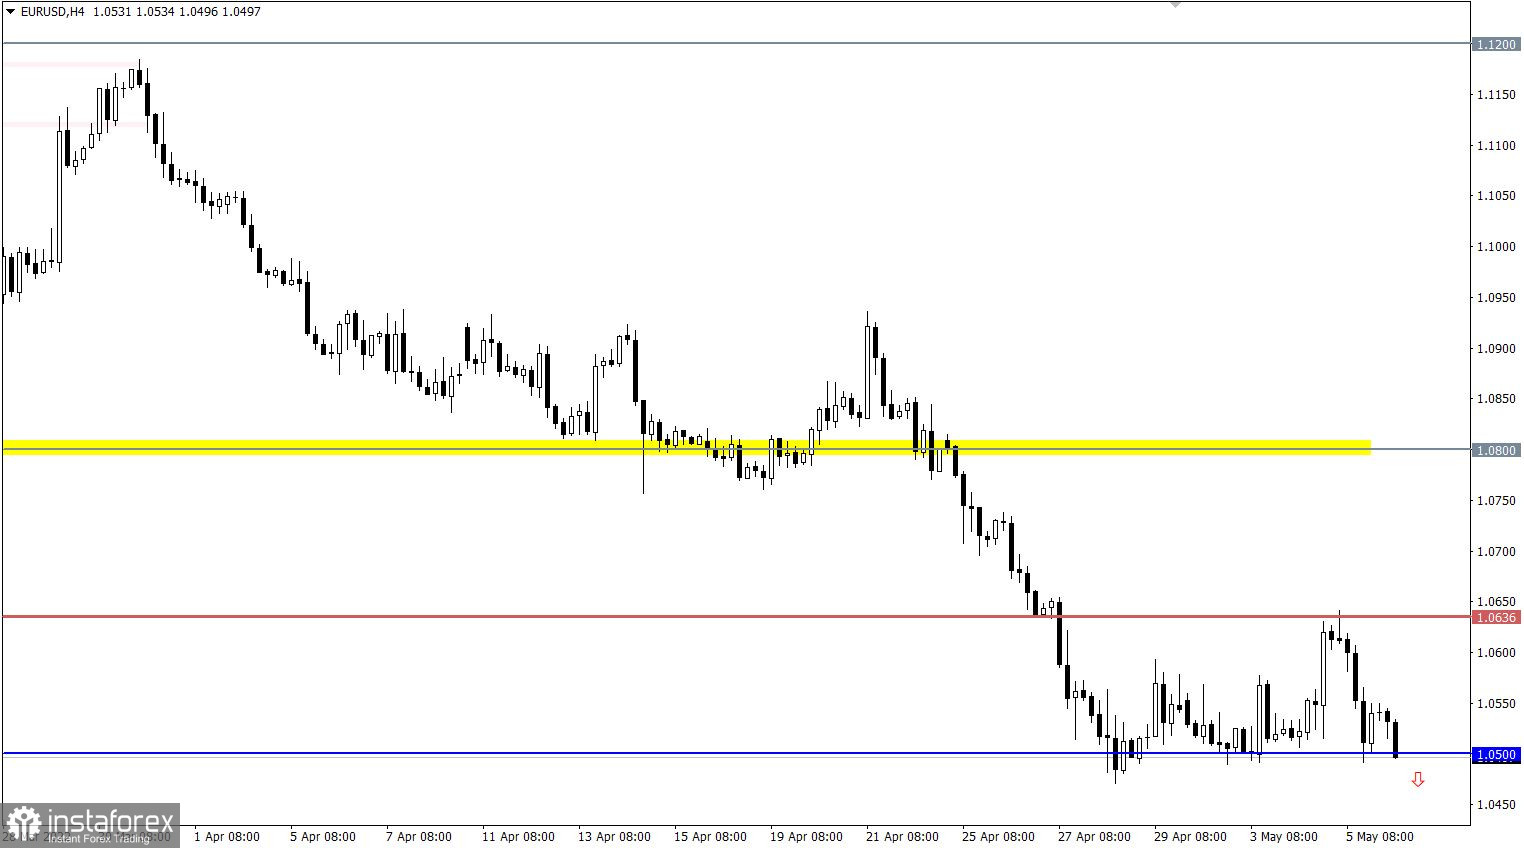
The EURUSD currency pair rebounded with surgical precision from the level of 1.0636, which was a local bottom in the spring of 2020. At the moment, this value serves as a resistance level in the market, which played positively on the volume of short positions. Due to the rebound, the quote returned to the area of the base, where the level of 1.0500 serves as a support.
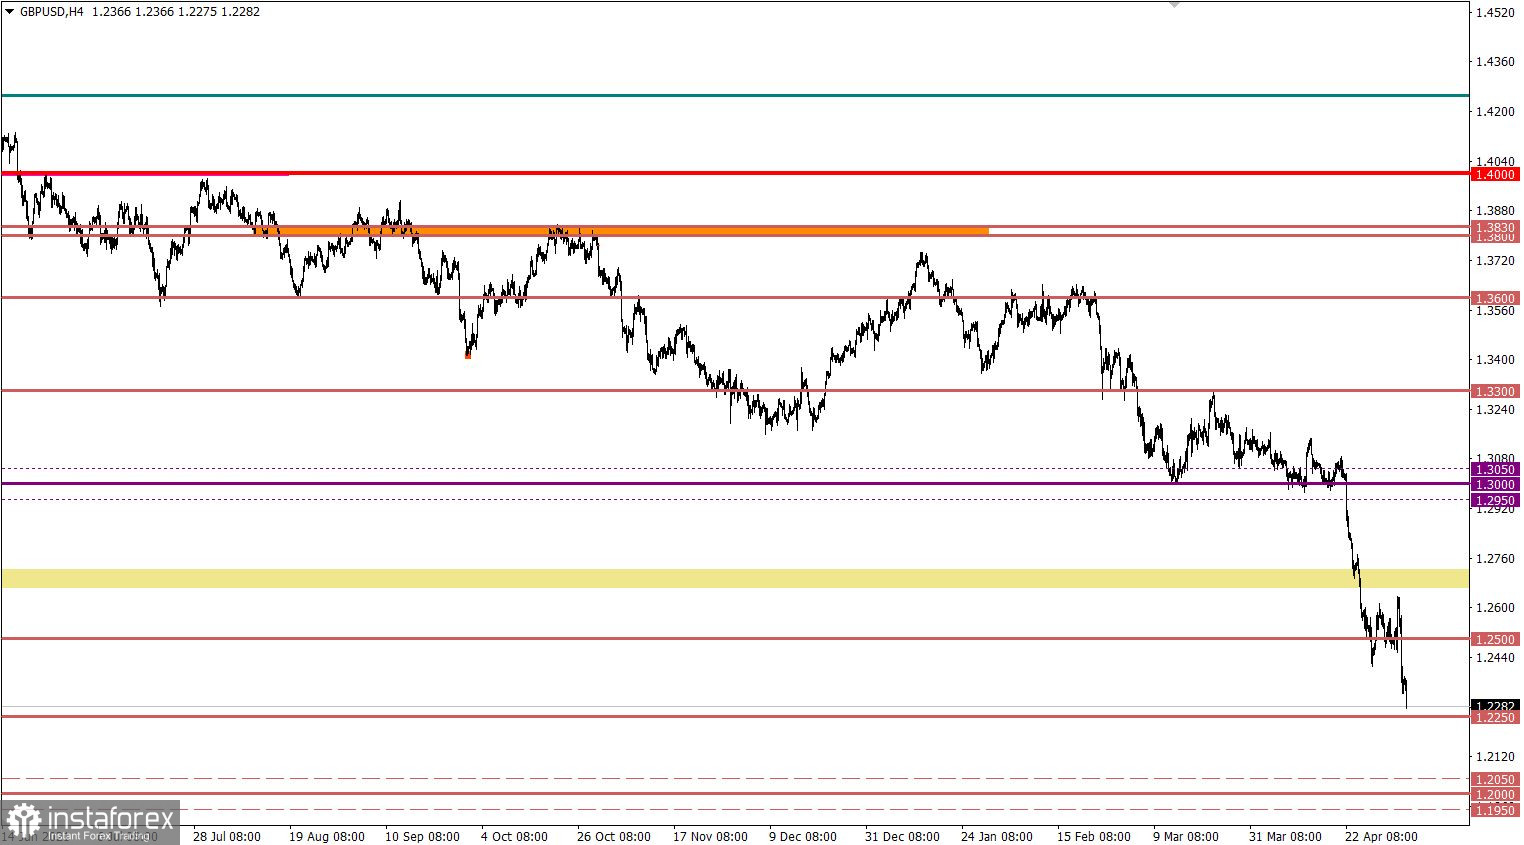
The pound sterling, despite the increase in interest rates by the Bank of England, collapsed by 274 points (2.17%). This inertial-speculative price move led to the prolongation of the medium-term downward trend. As a result, the quote was at the levels of June 2020.
On the trading chart of the daily period, there is an intensive recovery of dollar positions. Since June 2021, the US dollar has appreciated by 13% against the pound sterling.
Economic calendar for May 6
The main macroeconomic event on Friday is considered to be the report of the United States Department of Labor, which predicts by no means bad indicators. The unemployment rate could drop from 3.6% to 3.5%, and 385,000 new jobs could be created outside of agriculture. We have a strong US labor market, which could support the US dollar.
Time targeting
US Department of Labor Report - 12:30 UTC
Trading plan for EUR/USD on May 6
The downward cycle is still relevant among traders. The strongest increase in the volume of short positions will occur when the price holds below the level of 1.0500 in a four-hour period. In this case, the sellers will have a high chance of prolonging the downward trend towards the local bottom of 2016.
Otherwise, the amplitude of 1.0500/1.0600 may continue to form, delaying the stage of building a downward trend.
Trading plan for GBP/USD on May 6
Such an intense downward movement last day led to a local overheating of short positions, which caused a short-term stagnation at 1.2324. At the same time, the downward mood among traders remains. After a short stop or pullback, the downward cycle will resume movement. The level of 1.2250 can become a variable point of support on the sellers' way. The strongest point of support is at the psychologically important level of 1.2000.
What is reflected in the trading charts?
A candlestick chart view is graphical rectangles of white and black light, with sticks on top and bottom. When analyzing each candle in detail, you will see its characteristics of a relative period: the opening price, closing price, and maximum and minimum prices.
Horizontal levels are price coordinates, relative to which a stop or a price reversal may occur. These levels are called support and resistance in the market.
Circles and rectangles are highlighted examples where the price of the story unfolded. This color selection indicates horizontal lines that may put pressure on the quote in the future.
The up/down arrows are the reference points of the possible price direction in the future.


