


So the trading week, so full of important events, has ended. In today's article on the main currency pair of the Forex market, we will summarize the results of the closed trading five days. And let's start with Friday's reports on the US labor market. As the author suggested in his previous Friday article, American labor reports are likely to come out mixed. As a result, that's exactly what we saw. At the same time, the assumptions of the chairman of the Federal Reserve System that unemployment may decrease a little more, and the creation of new jobs in non-agricultural sectors of the economy is likely to slow down, were not confirmed in the labor market data for April. Unemployment in the United States, contrary to the forecast of 3.5%, remained at the same level of 3.6%, but the number of newly created jobs, or Nonfarm Payrolls, exceeded economists' expectations of 390 thousand and amounted to 428 thousand. Thus, we observed the opposite picture from previous data, when unemployment fell more than expected, and Nonfarm Payrolls came out weaker than expected and fell short of the forecast value. As for the growth of average hourly wages, they also grew weaker than the forecast of 0.4% and showed an increase of only 0.3%. In general, Friday's labor reports cannot be considered a failure in any way. The fact that the indicators came out mixed is explained by already familiar and well-known factors: the failure of the supply chain due to the COVID-19 pandemic, high inflation, the Chinese aggravation of the coronavirus, as well as the events in Ukraine. Each of these factors has its negative impact on the global economy as a whole and finds its echoes in the American economy. Anyway, the labor market in the United States is still strong, and there is no doubt about it yet.
Meanwhile, voices from the European Central Bank (ECB) are sounding louder and louder about the imminent start of monetary policy tightening. Thus, ECB representative Holzmann believes that in June the European regulator will discuss the feasibility of raising rates and will take such a step this year. Holzmann also admitted that the American economy had overcome the consequences of COVID-19 earlier and was ahead of the European economy by about six months in terms of its condition. Another ECB representative considers it appropriate to raise the main interest rate by 25 basis points in July this year. However, so far this is just talk. But the Fed last Wednesday, after the first increase in the federal funds rate by 25 basis points, repeated this move, raising the rate by 50 bps. However, the market reacted to this decision of the US Central Bank, to put it mildly, with coolness, exposing the US dollar to sales. As I wrote earlier, overly inflated market expectations played a cruel joke on the US currency, many of which were reduced to an increase in the base rate not by 50, but by 75 bp. What eventually happened and how the EUR/USD currency pair completed the last week's trading - will see on the price chart.
Weekly
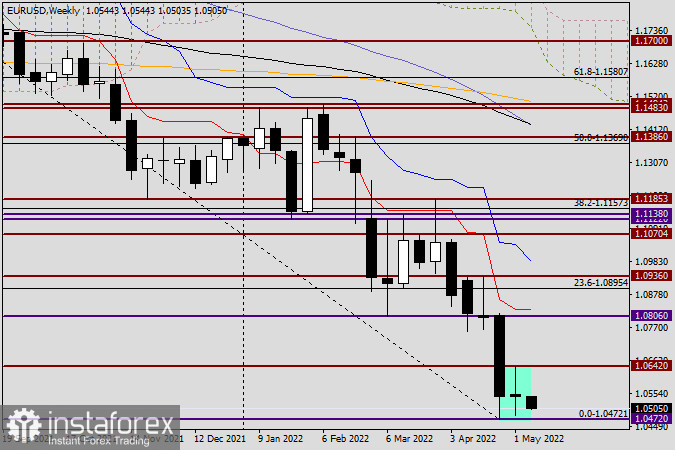
The highlighted last weekly candle perfectly demonstrates some changes in market sentiment, and this is despite the Fed's latest interest rate hike. The candle, which was formed following the results of trading on May 2-6, can most likely be perceived as a reversal model. First, it appeared after unsuccessful attempts by players to lower the rate to go down the most important psychological, historical and technical level of 1.0500. Second, this candle has equidistant shadows, which indicate the alignment of forces of the opposing sides. It is especially characteristic that the last candle of the Doji variety appeared on the weekly chart after a huge black candle. Another important point is the fact that during the decline and the bears' attempts to continue implementing their plans, the minimum values of the last candle turned out to be higher than the previous lows. This indicates that there is very strong support in the area of 1.0483-1.0472, and the market is not willing or ready to trade EUR/USD under the landmark level of 1.0500 yet. In my personal opinion, the picture on the weekly timeframe is more conducive to a reversal of the pair in the north direction. Although even if the growth takes place, it is too early to talk about a reversal and a trend change, it is quite acceptable to count on a long-awaited course correction. Nevertheless, even with the last weekly candle, I would not completely cross out the bearish scenario. Briefly about the tasks of the warring parties at the auction of the current five-day period. Euro bulls, to confirm their intentions to make at least a good course correction, need to rewrite the previous highs at 1.0642 and close the week above this level. Their opponents need to break through the strong support zone 1.0483-1.0472 already indicated in this review and close the week below 1.0472.
Daily
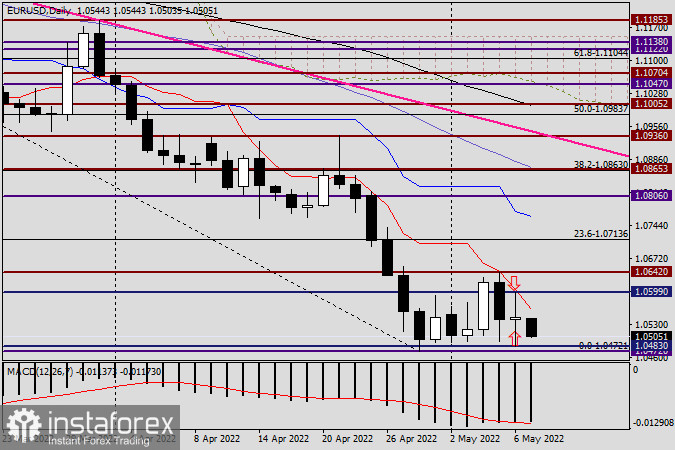
The daily chart shows as well as possible what kind of confusion the American mixed labor reports brought to the course of trading. This can be judged by the Friday candle, which is very similar to the last weekly candle. By the way, the high probability of multidirectional price movements was also mentioned in Friday's article, which happened. Looking at the auction on May 6, once again it is worth paying attention to the strength of the technical level of 1.0600. I believe that it is not for nothing that a fairly strong downward rebound occurred from 1.0599, as a result of which such an impressive upper shadow of the candle for May 6 appeared. If we summarize all of the above and move on to trading recommendations, then I will express my vision on this issue. I believe that at this stage of trading, the probability of both successful purchases and profitable sales remains. I suggest tracking the appearance of bearish candles in the price zone 1.0590-1.0613, after which sell a pair with targets near 1.0550 or on the approach to 1.0500. If a bullish candlestick analysis model appears on this or smaller time intervals during attempts to break the support level of 1.0483 (lows on May 6), a signal will be received to open purchases with the nearest targets in the area of 1.0585-1.0600. That's all for now.


