


GBP/USD
Analysis:
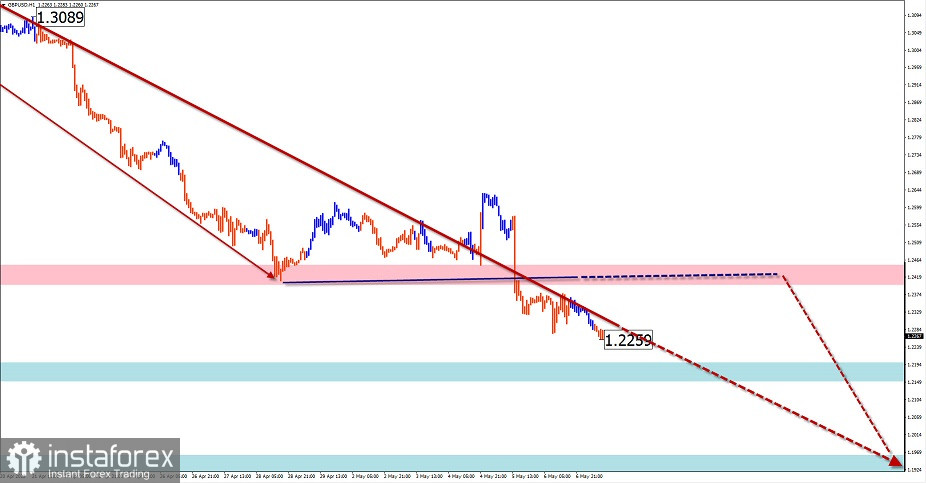
The weekly scale of the British pound chart shows that the current wave of the instrument is ascending. It has been counting down since March of the 20th year. The middle correction part of the wave (B) is directed downwards and has not yet been completed. The structure of this section looks complete, but there are no signals of an imminent change of direction. Quotes are located within the boundaries of a powerful zone of a potential reversal of the largest timeframe.
Forecast:
The general downward movement vector is expected to continue in the coming week. A short-term pullback to the resistance zone is possible in the coming days. The greatest activity should be expected by the end of the week. In case of a breakthrough of the lower limit of the nearest support, we can wait for the continuation of the decline to the next zone.
Potential reversal zones
Resistance:
- 1.2400/1.2450.
Support:
- 1.2200/1.2150;
- 1.2010/1.1960.
Recommendations:
Purchases on the pound market are directed against the trend, so the lot should be reduced and closed at the first signals of a reversal. It is optimal to skip the oncoming sections, opening sales in the resistance zone.
AUD/USD
Analysis:
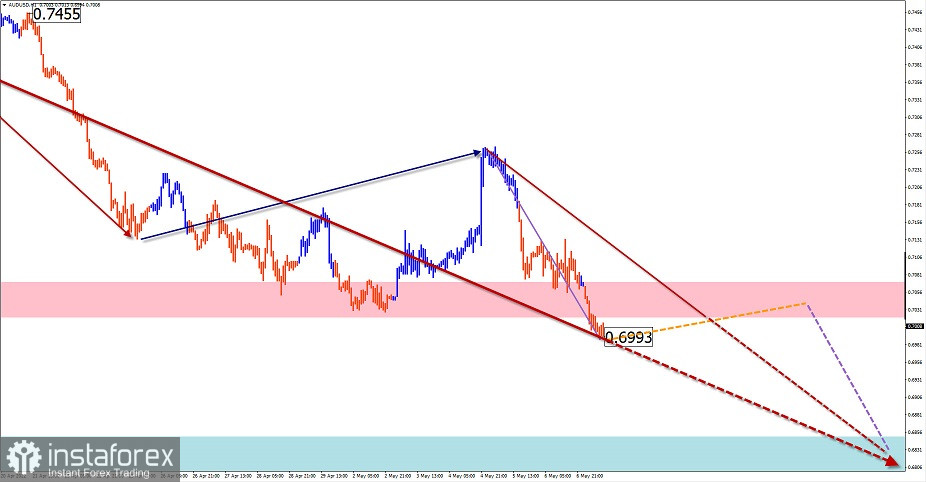
In mid-March 2020, an incomplete ascending wave structure started on the chart of the Australian dollar. Since the beginning of last year, the price has been forming a complex correction. Quotes are at the lower edge of the powerful support zone of the senior TF.
Forecast:
In the coming week, a flat movement mood is more likely in the first days. After breaking through the powerful support, the price will need to gain a foothold and increase its wave level. By the end of the week, we can expect an increase in activity and the resumption of the downward course of movement.
Potential reversal zones
Resistance:
- 0.7020/0.7070.
Support:
- 0.6850/0.6800.
Recommendations:
There will be no conditions for purchases in the Australian dollar market in the coming days. In the area of the calculated resistance, it is recommended to monitor emerging signals for the sale of the pair.
USD/CHF
Analysis:
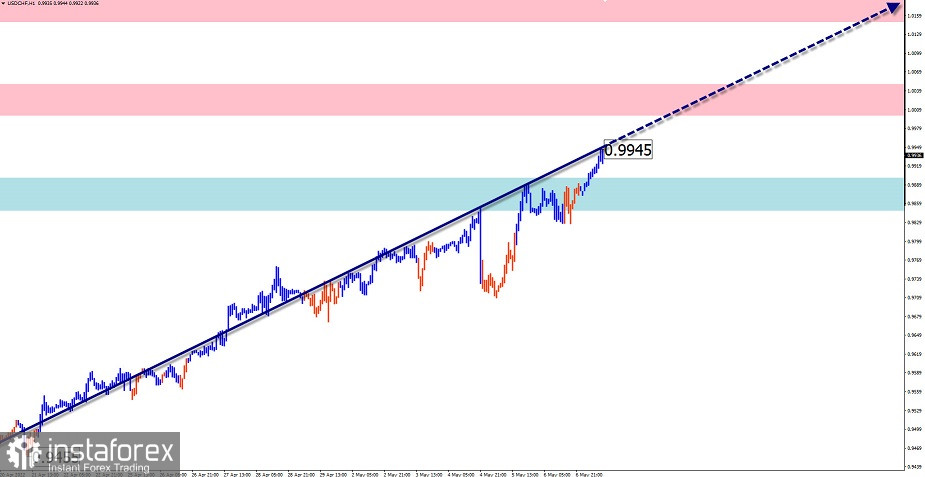
The wave level of the upward wave that started in January last year exceeded the correction level of the previous downward trend. As a result of the impulse spurt, the pair's quotes reached a zone of strong resistance on the weekly scale of the chart. There are no signals of an imminent reversal on the chart.
Forecast:
In the coming days, there is a high probability of the transition of the impulse movement to the lateral plane. Activation and resumption of the price rise are more likely on Thursday-Friday. In case of a breakthrough of the upper limit of the nearest resistance, the next settlement zone will act as a reference point.
Potential reversal zones
Resistance:
- 1.0150/1.0200;
- 1.0000/1.0050.
Support:
- 0.9900/0.9850.
Recommendations:
Selling on the pair's market in the coming days will be very risky and is not recommended. The optimal tactic would be to refrain from entering the pair's market until the counter pullback is completed with the search for reversal signals to buy the pair.
EUR/JPY
Analysis:
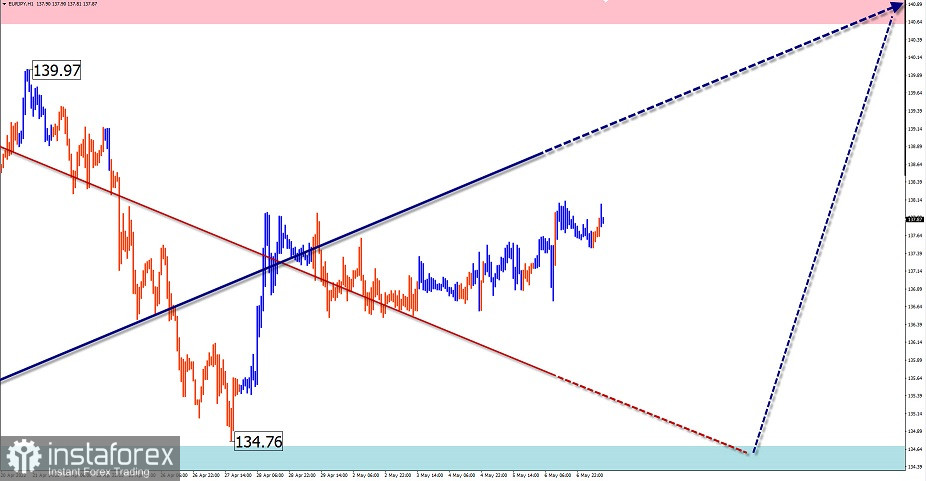
The current wave structure of the euro/Japanese yen pair can be considered a bullish wave, which has been counting since May 2020. On March 7, the final part (C) started. By now, the pair's quotes are in the area of a powerful resistance zone of the weekly TF. Before continuing the price rise, the price of the pair needs to gain a wave level in the correction.
Forecast:
In the coming week, the price is expected to move sequentially from the lower boundary to the upper boundary of the formed price corridor. The change is expected no earlier than Wednesday-Thursday. A breakthrough of the channel further indicated by the zones in the coming week is unlikely.
Potential reversal zones
Resistance:
- 140.60/141.10.
Support:
- 134.70/134.20.
Recommendations:
Trading this week on the pair's chart is possible only on the intraday. Sales are riskier. You should reduce the lot as much as possible, closing deals at the first signals of a reversal. Purchases from the support zone are more promising.
US dollar index
Analysis:
Since the beginning of last year, the position of the US dollar relative to other currencies has been steadily strengthening. The chart of the dollar index has an impulse type of growth. Quotes have reached the resistance zone of the monthly TF. The wave structure looks complete at the time of analysis, but there are no signals of an imminent change of course on the chart.
Forecast:
In the coming week, there is a high chance of the transition of the impulse movement of the index mainly to the side plane. In the coming days, an attempt to put pressure on the resistance zone is likely. Then you can count on a stop of growth and the beginning of a "sideways".
Potential reversal zones
Resistance:
- 106.00/106.50.
Support:
- 103.00/102.50.
Recommendations:
Stopping the strengthening of the US dollar and the beginning of its correction should give an impetus to the growth of the national currencies in the main pairs. It should be borne in mind that this trend is temporary.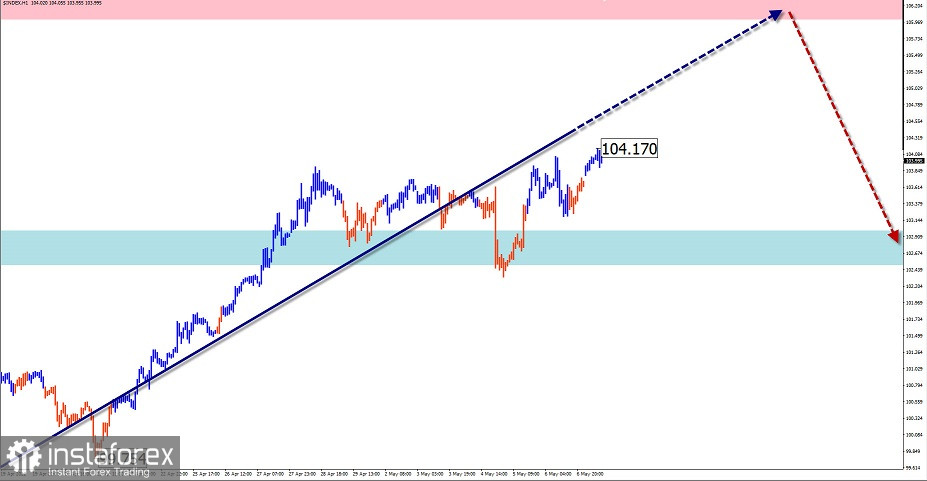
Explanations: In the simplified wave analysis (UVA), all waves consist of 3 parts (A-B-C). On each TF, only the last, incomplete wave is analyzed. The solid background of the arrows shows the formed structure, and the dotted one shows the expected movements.
Attention: The wave algorithm does not take into account the duration of the movements of the instruments in time!


