


Analysis of Monday's trades:30M chart of GBP/USD
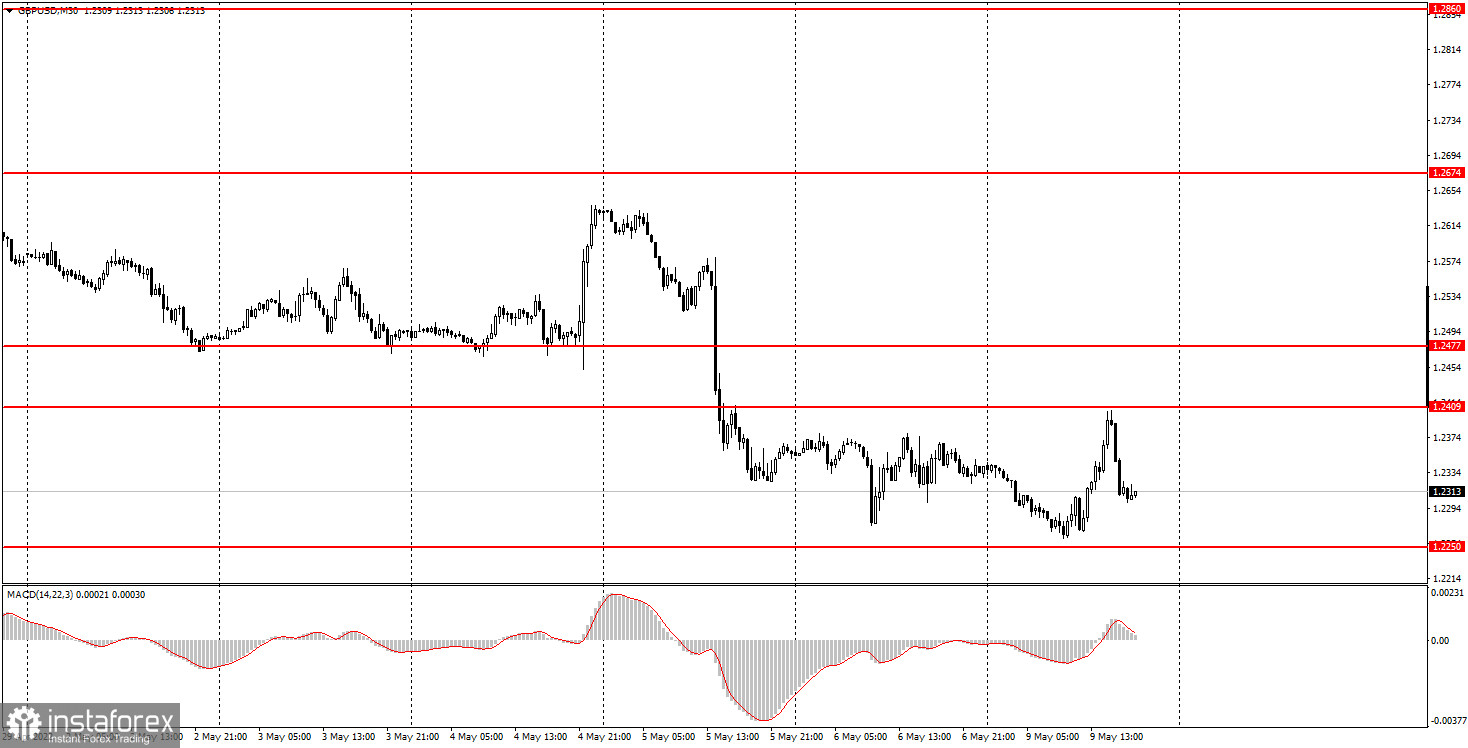
On Monday, GBP/USD saw an increase in volatility. The pair went about 150 pips from the low to the high of the day, which is similar to the reaction to a meeting of the US Fed of the Bank of England. Yet, there were no such triggers on Monday. Indeed, there were absolutely no important events or news on Monday at all. The BoE's Michael Saunders spoke on Monday. He said the interest rate should still be the core monetary policy tool. He also noted the regulator should raise the rate to the neutral level, which means further tightening. However, the pound had been on the rise even before Mr. Saunders' speech and went down right after it. Therefore, we could hardly say he became a trigger for the market. At the same time, the euro being three times less volatile showed a similar movement. Thus, we can say that the market did not react to Mr. Saunders' speech at all. The pound is still hovering around its 2-year lows. It also has considerable downward potential. There have been no trend lines or channels formed so far due to unsteady movements.
5M chart of GBP/USD
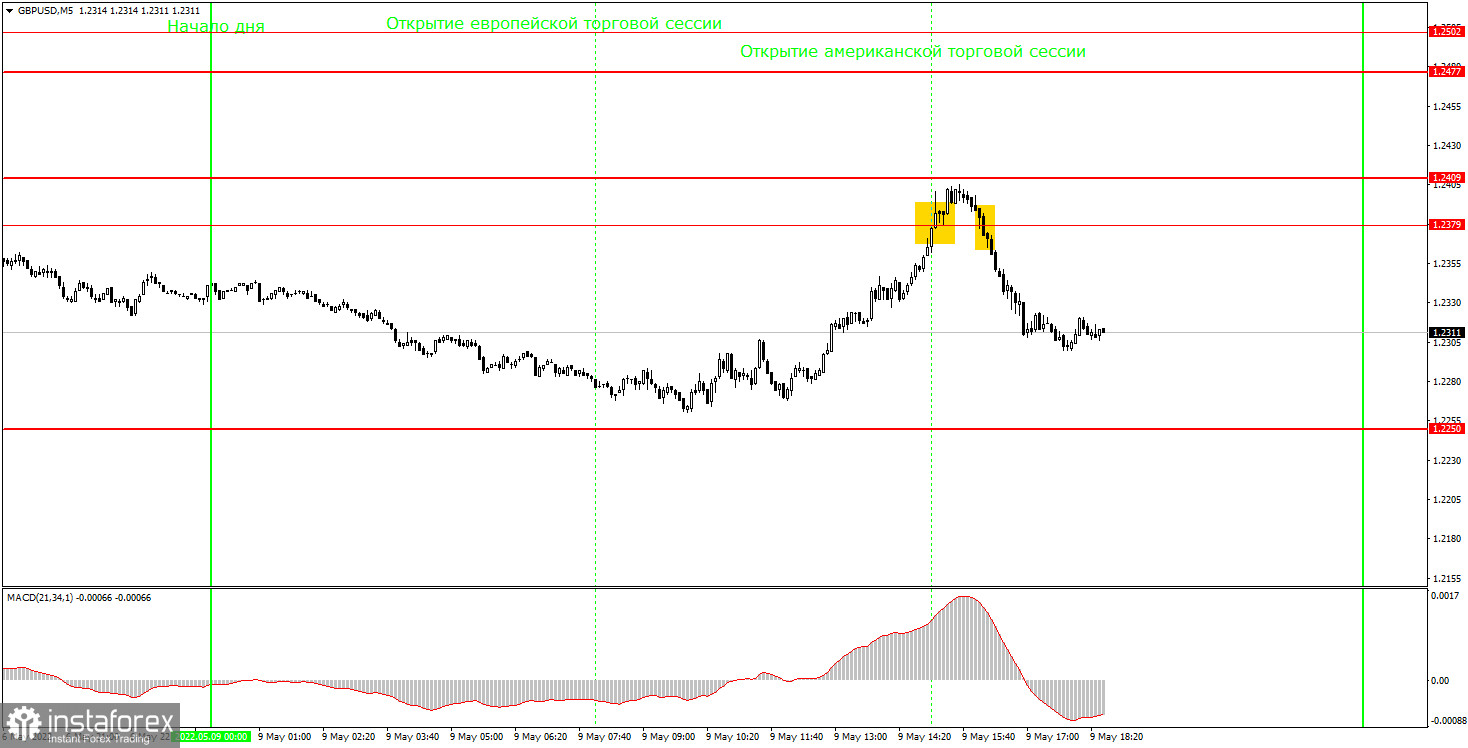
In the M5 time frame, the pair moved in a trend on Monday. Two trading signals were produced, with one of them being a false one. The pair broke through 1.2379 at the beginning of the North American session. It was a buy signal. It should have been ignored because at the moment it was created, the pair had already grown by 130 pips. For an uneventful Monday, it was a rather strong move. The sell signal was made when the price consolidated below 1.2379. It was the time to open trades because at least a small pullback should follow after such a steep rise. Beginner traders could have earned about 40-50 pips of profit. Trades should have been closed manually as the quote failed to reach the 1.2250 mark during the day. Against that backdrop, it would be a good profit and almost without risks.
Trading plan for Tuesday:
In the 30M time frame, the downtrend goes on. The pound has recently lost 700 pips, and all its attempts to enter a correction ended in vain, including a 150 pips increase on Monday. So far, the quote has been unable to break through the 1.2409 level. So, we are unlikely to see its steep rise any time soon. In the M5 time frame, levels 1.2250, 1.2409, 1.2477, and 1.2502 stand as targets. A stop-loss order should be set at the breakeven point as soon as the price passes 20 pips in the right direction after a trade has been opened. The macroeconomic calendar in the UK contains no important releases on Tuesday. In the US, several Fed officials will speak. However, their speeches are unlikely to trigger market jitters. In any case, the pound is still very volatile and will continue to be this way on Tuesday.
Basic principles of the trading system:
1) The strength of the signal depends on the time period during which the signal was formed (a rebound or a break). The shorter this period, the stronger the signal.
2) If two or more trades were opened at some level following false signals, i.e. those signals that did not lead the price to the Take Profit level or the nearest target levels, then any consequent signals near this level should be ignored.
3) During the flat trend, any currency pair may form a lot of false signals or produce no signals at all. In any case, the flat trend is not the best condition for trading.
4) Trades are opened in the time period between the beginning of the European session and until the middle of the American one when all deals should be closed manually.
5) We can pay attention to the MACD signals in the 30M time frame only if there is good volatility and a definite trend confirmed by a trend line or a trend channel.
6) If two key levels are too close to each other (about 5-15 pips), then this is a support or resistance area.
How to interpret charts:
Support and resistance levels can serve as targets when buying or selling. You can place Take Profit near them.
Red lines are channels or trend lines that display the current trend and show which direction is better to trade.
MACD indicator (14,22,3) is a histogram and a signal line showing when it is better to enter the market when they cross. This indicator is better to be used in combination with trend channels or trend lines.
Important speeches and reports that are always reflected in the economic calendars can greatly influence the movement of a currency pair. Therefore, during such events, it is recommended to trade as carefully as possible or exit the market in order to avoid a sharp price reversal against the previous movement.
Beginner traders should remember that every trade cannot be profitable. The development of a reliable strategy and money management is the key to success in long-term trading.


