


Analysis of Tuesday's deals:
30M chart of the EUR/USD pair.
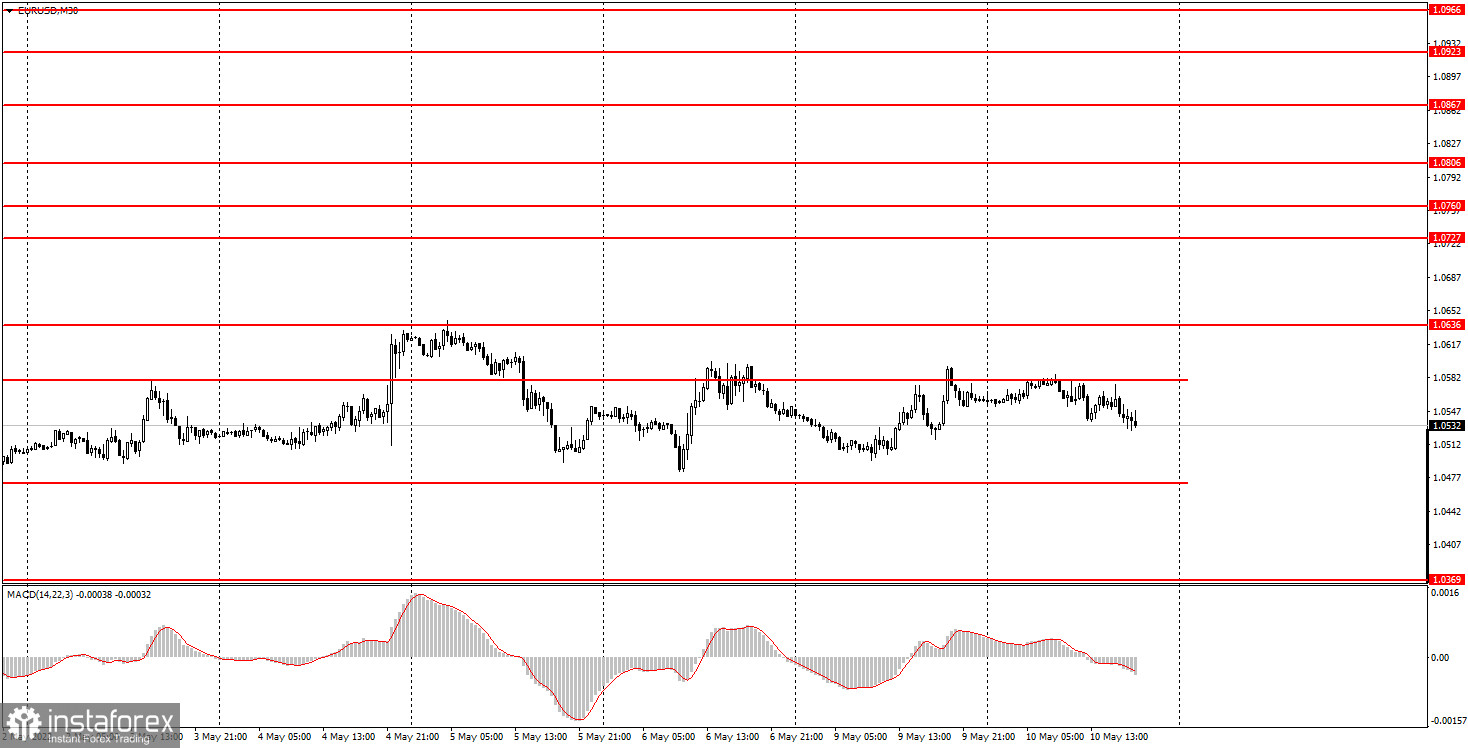
The EUR/USD currency pair on Tuesday was already trading with low volatility and inside the same side channel, which is indicated in the illustration above. The euro/dollar pair bounced off the upper border of this channel yesterday. Today, everything is going to the fact that the quotes will fall to the lower border of the channel. In general, the price remains near its 5-year lows and very close to 20-year lows. Thus, the market so far shows only its utter unwillingness to buy a pair. And if no one buys a pair, then sooner or later it will resume falling. By and large, the euro currency has only one salvation now: if the bears start taking profits on their short positions (now there is no such thing). This will lead to an upward rebound in the price and this movement can be picked up by bulls. The macroeconomic background was absent today, so there was nothing for traders to react to during the day. The movement is now almost completely flat. And it is always difficult to trade in the flat.
5M chart of the EUR/USD pair.
In a 5-minute timeframe, the technical picture looks very simple. During the day, the pair bounced four times from the 1.0578 level, thus forming four sell signals. However, in none of the cases could the price fall to its nearest level of 1.0490. At least twice, a Stop Loss set at breakeven was triggered (it should be set after passing 15 points in the right direction). And after the Stop Loss was triggered for the second time, it was no longer necessary to work out the following sell signals formed around the same level of 1.0578. Thus, today novice traders have received neither profit nor loss. And the pair once again failed to start forming an upward correction and was unable to leave the side channel.
How to trade on Wednesday:
On the 30-minute timeframe, the trend remains downward, despite the flat formed. We believe that the fall may resume at any moment, but we draw the attention of newcomers to the fact that the euro currency has been falling for quite a long time and the correction will begin sooner or later. However, it may start later, but not now. The fundamental background for the euro continues to leave the best, as well as the geopolitical one, so there is no support from these factors now. On the 5-minute TF tomorrow, it is recommended to trade by levels 1.0369, 1.0471-1.0490, 1.0578-1.0593, 1.0636, and 1.0697. When passing 15 points in the right direction, you should set the Stop Loss to breakeven. ECB President Christine Lagarde will give a speech at the European Union on Wednesday. Potentially, this is quite an important event, but everything will depend on what Lagarde says. If nothing is interesting in her speech, then there will be no market reaction. Of course, it is impossible to predict in advance what the head of the ECB will talk about. In America, an important inflation report will be released tomorrow, which for the first time in a long time may begin to slow down. Therefore, we believe that a reaction to this report can and should follow.
Basic rules of the trading system:
1) The strength of the signal is calculated by the time it took to generate the signal (rebound or overcoming the level). The less time it took, the stronger the signal.
2) If two or more trades were opened near a certain level on false signals, then all subsequent signals from this level should be ignored.
3) In a flat, any pair can form a lot of false signals or not form them at all. But in any case, at the first signs of a flat, it is better to stop trading.
4) Trade transactions are opened in the period between the beginning of the European session and the middle of the American session when all transactions must be closed manually.
5) On a 30-minute TF, signals from the MACD indicator can be traded only if there is good volatility and a trend, which is confirmed by a trend line or a trend channel.
6) If two levels are located too close to each other (from 5 to 15 points), then they should be considered as a support or resistance area.
What's on the charts:
Price support and resistance levels - target levels when opening purchases or sales. Take Profit levels can be placed near them.
Red lines - channels or trend lines that display the current trend and show in which direction it is preferable to trade now.
MACD indicator (14,22,3) is a histogram and a signal line - an auxiliary indicator that can also be used as a signal source.
Important speeches and reports (always contained in the news calendar) can greatly influence the movement of a currency pair. Therefore, during their exit, it is recommended to trade as carefully as possible or exit the market to avoid a sharp price reversal against the previous movement.
Forex beginners should remember that every trade cannot be profitable. The development of a clear strategy and money management are the keys to success in trading over a long period.


