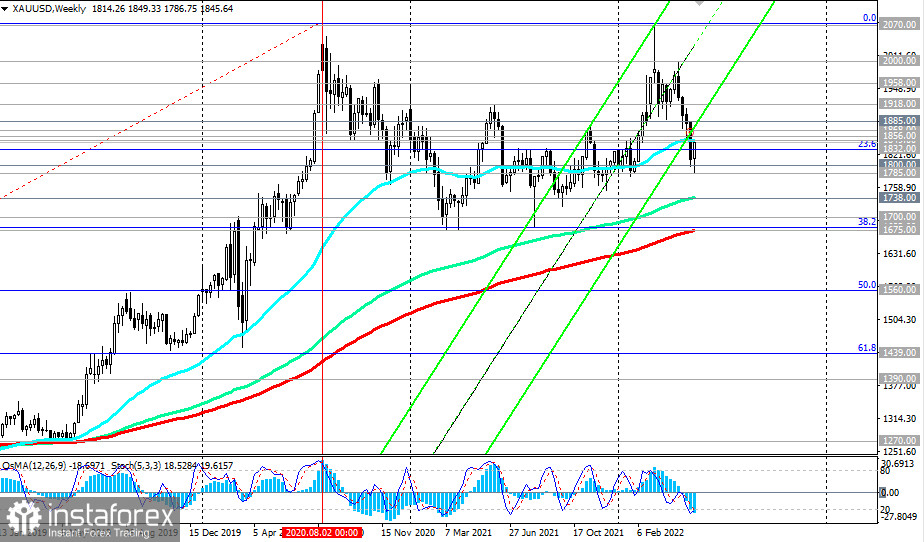
For the previous four weeks in a row, the XAU/USD pair has been declining after reaching the "round" mark of 2000.00 in the middle of last month. When assessing the possibility (or necessity) of investing in this precious metal, investors put the Fed's policy in the first place, relegating geopolitical and inflationary risks to the background.

However, the situation may again turn in favor of gold buyers. Despite the slowdown in inflation in the US in April (for the first time in several months), it still remains high—above the Fed's target level of 2%, and the worsening economic conditions and the collapse of stock markets, increased geopolitical tensions in Europe will provide additional support to gold quotes, while (by Powell's own admission) the market has already largely priced in the upcoming two 0.50% interest rate hikes.

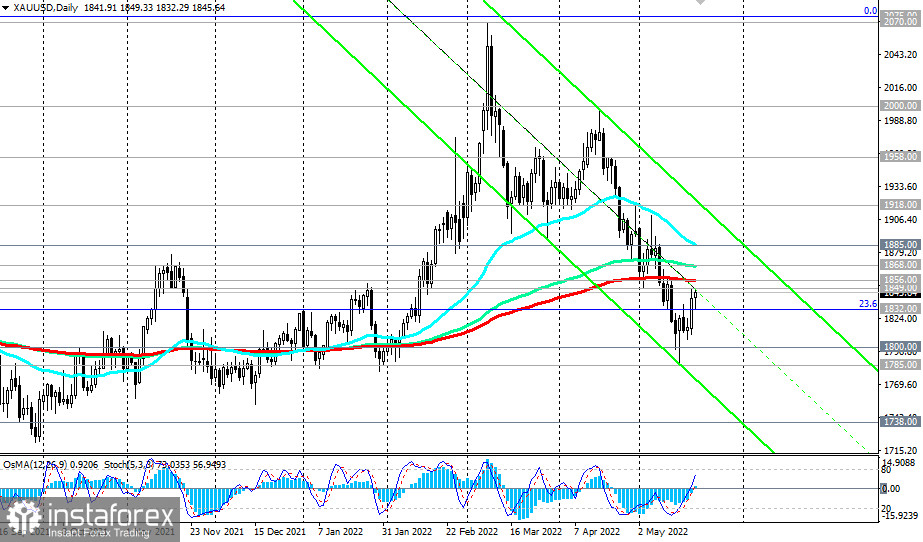
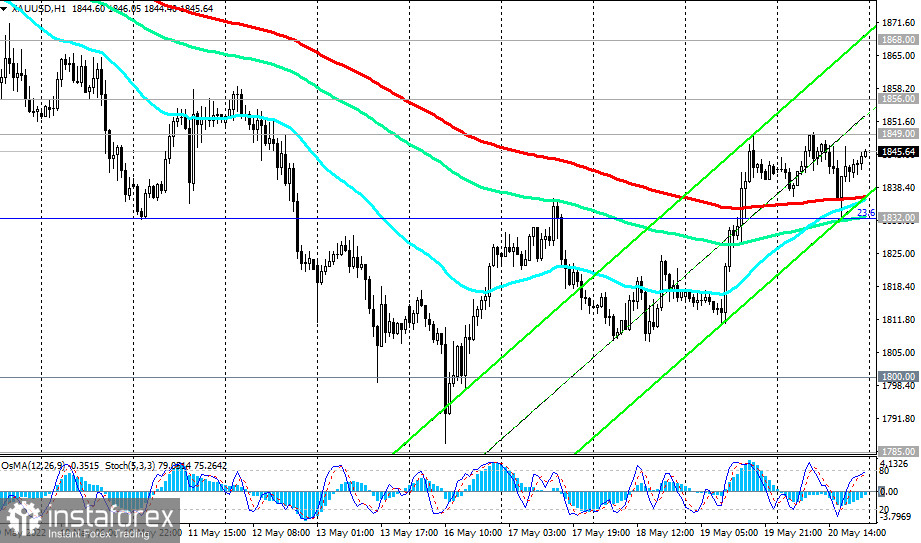
Last week, the XAU/USD pair attempted to break through the balance zone that had been established over the previous half of the year (near the support level of 1800.00). However, the attempt turned out to be unsuccessful so far: investors quickly bought out gold futures at attractive prices, and the XAU/USD pair rose to the resistance level of 1849.00 (50 EMA on the weekly chart). The breakdown of long-term resistance levels 1849.00 (200 EMA on the daily chart), and 1868.00 (144 EMA on the daily chart) will finally return XAU/USD to the long-term bull market zone.

An alternative scenario will be associated with a breakdown of the support level of 1832.00 (23.6% Fibonacci retracement level to the growth wave from December 2015 and the mark of 1050.00) and a retest of support levels of 1800.00, 1785.00. Their breakdown will push XAU/USD to further decline towards key support levels 1738.00, and 1682.00 (38.2% Fibonacci level). A breakdown of the support level of 1675.00 (200 EMA on the weekly chart) will finally break the long-term bullish trend of XAU/USD.
Support levels: 1836.00 , 1832.00, 1800.00, 1785.00, 1738.00, 1700.00, 1682.00, 1675.00
Resistance levels: 1849.00, 1856.00, 1868.00, 1885.00, 1900.00, 1918.00, 1958.00, 2000.00, 2070.00, 2075.00
Trading Tips
Sell Stop 1829.00. Stop-Loss 1852.00. Take-Profit 1800.00, 1785.00, 1738.00, 1700.00, 1682.00, 1675.00
Buy Stop 1852.00. Stop-Loss 1829.00. Take-Profit 1856.00, 1868.00, 1885.00, 1900.00, 1918.00, 1958.00, 2000.00, 2070.00, 2075.00


