


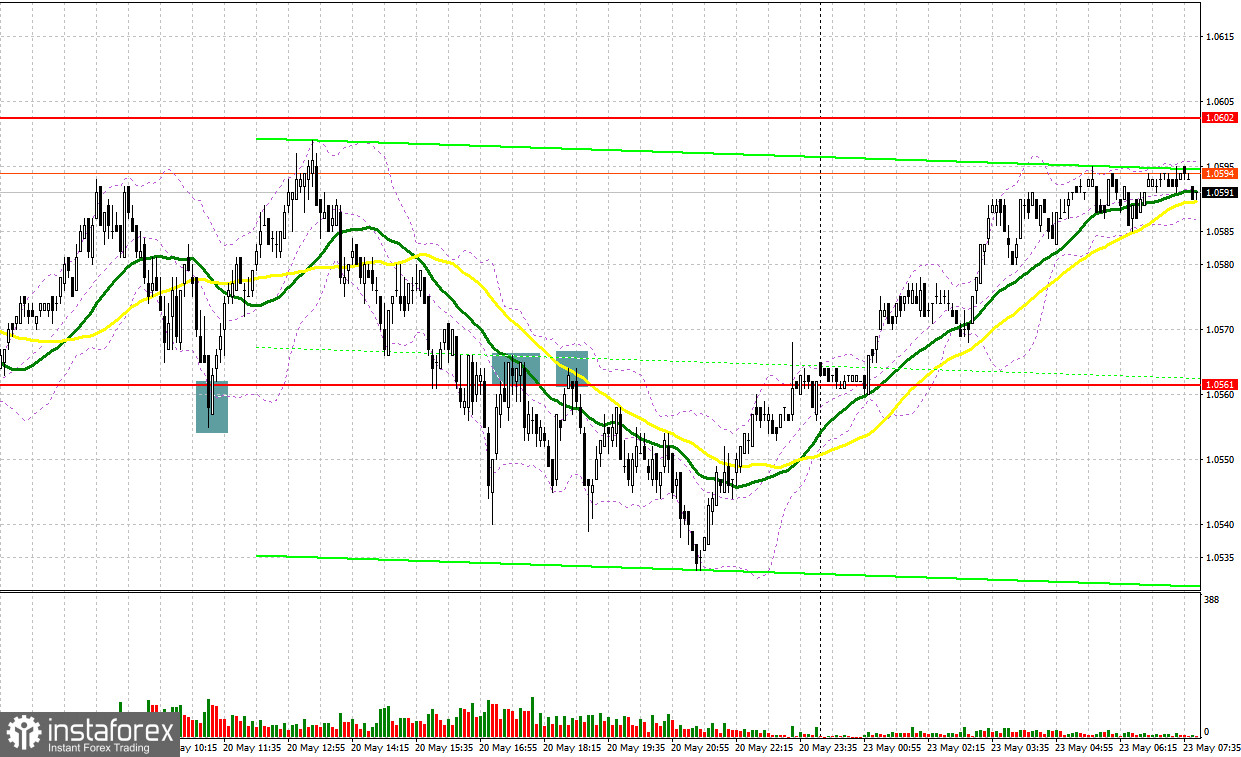
Last Friday, several good market entry signals were formed. I suggest you take a look at the 5-minute chart and figure out what happened. I paid attention to the level of 1.0561 in my morning forecast and advised you to make a decision on entering the market from it. Due to the lack of reports, the bears tried to put pressure on the euro again, but failed to settle below 1.0561. The result was a false breakout and a great signal for long positions in the euro in continuation of the bull market, which led to a 40 pip rally. In the afternoon, amid profit-taking, the bears still went below 1.0561, and several reverse tests of this level from the bottom up gave signals to open short positions. The pair fell from 15 to 20 points each time.
When to go long on EUR/USD:
Given that the pound bulls coped with their tasks on Friday, and in today's Asian session they compensated for all the losses observed by the bulls at the end of last week, we can expect the euro to continue rising and move above 1.0602. Good data on the business environment indicator, an indicator of the assessment of the current situation and economic expectations from the IFO in Germany, can help with this. If the May reports turn out to be surprising, this will lead to a breakthrough in EUR/USD to 1.0602, for which the struggle will unfold this morning.
However, the bulls' main task will still be to protect the support at 1.0561, which went well last Friday. I advise you to open long positions there only after forming a false breakout, by analogy with what I analyzed above with the prospect of a breakthrough of 1.0602. Slightly above 1.0561 are moving averages, which can also help the bulls. A breakthrough and test of 1.0602 is a new long entry signal, but a bigger upside move requires hawkish monetary policy from the European Central Bank. In case of an upward trend above 1.0602, the nearest target will be a high like 1.0640, where I recommend taking profits.
A more distant level will be 1.0691, but it will be quite difficult to get to it. With a downside scenario for EUR/USD and no bulls at 1.0561, pressure on the pair will quickly return. This will cause the bull market to stop and the pair to be stuck in the horizontal channel. The best option to buy would be a false breakout near the low of 1.0521. I advise you to open long positions immediately for a rebound only from 1.0486, or even lower - in the region of 1.0452, counting on an upward correction of 30-35 points within the day.
When to go short on EUR/USD:
The bears were defeated again, but the chance to retaliate remains. In case of growth, forming a false breakout at 1.0602, along with weak data on Germany, will lead to the first signal to open short positions with the prospect of a return to the intermediate support of 1.0561. A serious struggle will definitely unfold for this level again, so a breakdown and consolidation below this range, as well as a reverse test from the bottom up by analogy with what I analyzed above - all this will give a sell signal with dismantling the bulls' stop orders and a larger movement of the pair down to the area of 1.0521, where I recommend taking profits.
A more distant target will be the area of 1.0486, but it will be possible to reach this level only if the bulls completely surrender at the beginning of this week. If EUR/USD moves up in the first half of the day after the data on Germany is released, as well as the absence of bears at 1.0602, the upward trend may continue and there will really be talk of building a new bullish trend. The optimal scenario in this case would be short positions when a false breakout forms in the area of 1.0640. You can sell EUR/USD immediately on a rebound from 1.0691, or even higher - in the area of 1.0736, counting on a downward correction of 30-35 points.
COT report:
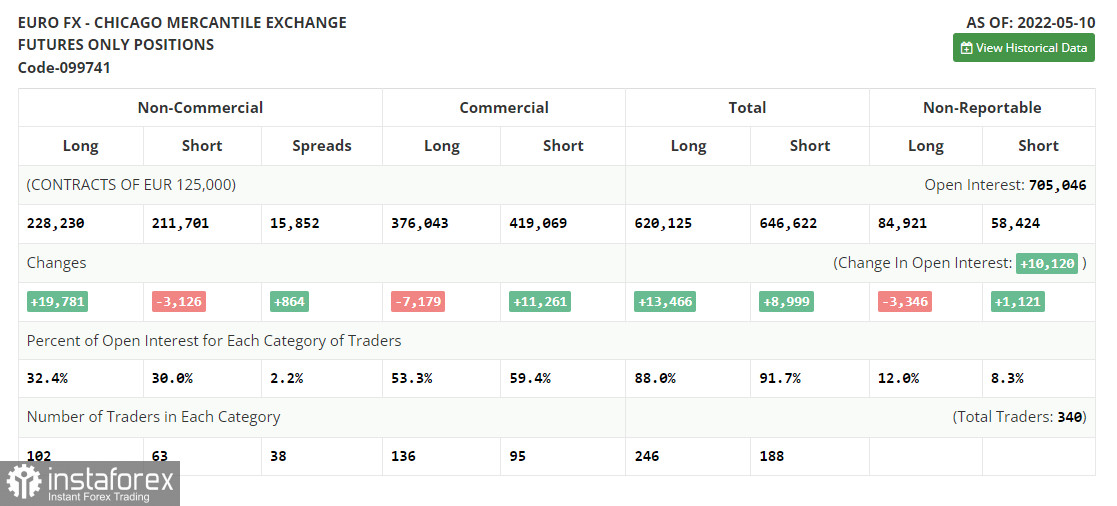
The Commitment of Traders (COT) report for May 10 shows a sharp increase in long positions and contraction in short ones. The euro's overbought status indicates interest from traders and investors. Recent statements from ECB policymakers arouse optimism in hope that the euro will be able to develop an upward cycle. The ECB governing board will increase the deposit rate by 0.25% as early as July 2022. The next rate hikes will follow in September and in December. The deposit rate will stand at 0.25% at the year-end.
Besides, the key interest rate will be raised in September and in December from the current zero level to 0.5%. Such a hawkish policy will allow the euro buyers to touch the bottom in the near future. Nevertheless, the US Fed alongside escalating geopolitical jitters might derail such plans. Let me remind you that the US Fed intends to pursue aggressive monetary tightening. There are rumors that the FOMC could lift interest rates by 0.75% at a time at the next policy meeting. This scenario gives a clear signal to buy the US dollar in the medium term.
The COT report reads that long non-commercial positions jumped rapidly by 19,781 from 208,449 to 228,230. At the same time, short mom-commercial positions dropped by 3,126 from 214,827 to 211,701. I noted that the low rate of the euro makes it more attractive for traders. Currently, we see that more buyers are entering the market. The overall non-commercial net positions rose to 16,529 at the end of the last week against the negative -6,378 a week ago. EUR/USD closed last week almost flat at 1.0546 against 1.0545 in the previous week.
Indicator signals:
Moving averages
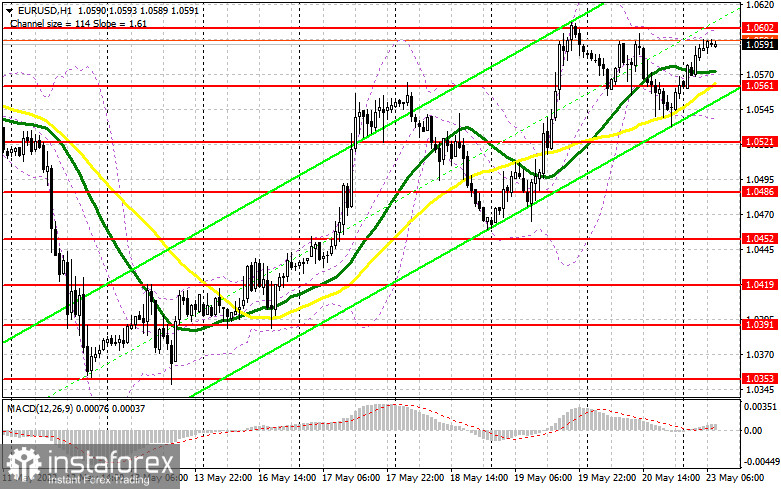
Trading is slightly above the 30 and 50-day moving averages, which indicates continued growth of the euro.
Note: The period and prices of moving averages are considered by the author on the H1 hourly chart and differs from the general definition of the classic daily moving averages on the daily D1 chart.
Bollinger Bands
In the event of a decline, the lower border of the indicator around 1.0535 will act as support. In case of growth, the upper border of the indicator in the area of 1.0615 will act as resistance.
Description of indicators
- Moving average (moving average, determines the current trend by smoothing out volatility and noise). Period 50. It is marked in yellow on the chart.
- Moving average (moving average, determines the current trend by smoothing out volatility and noise). Period 30. It is marked in green on the chart.
- MACD indicator (Moving Average Convergence/Divergence — convergence/divergence of moving averages) Quick EMA period 12. Slow EMA period to 26. SMA period 9
- Bollinger Bands (Bollinger Bands). Period 20
- Non-commercial speculative traders, such as individual traders, hedge funds, and large institutions that use the futures market for speculative purposes and meet certain requirements.
- Long non-commercial positions represent the total long open position of non-commercial traders.
- Short non-commercial positions represent the total short open position of non-commercial traders.
- Total non-commercial net position is the difference between short and long positions of non-commercial traders.


