


Hello, dear traders!
Last week, GBP/USD finally retraced up. Earlier, the quote had fallen to the 2-year low. Meanwhile, the pound had lost about 900 pips. Notably, the sterling is about deep corrections when it comes to mixed situations where it is neither a bounce nor a reversal yet. From the technical point of view, the greenback now looks weaker. Amid growing speculation that the world's largest economy is facing serious recession risks, investors have turned to other safe havens, which are the Swiss franc and the Japanese yen.
As for the British pound, last week, the currency received support from positive macro results, especially retail sales. In addition, the BoE's leading economist Huw Pill saw the need for further rate hikes due to increased inflationary risks. Let's now switch to the technical picture on charts.
Weekly
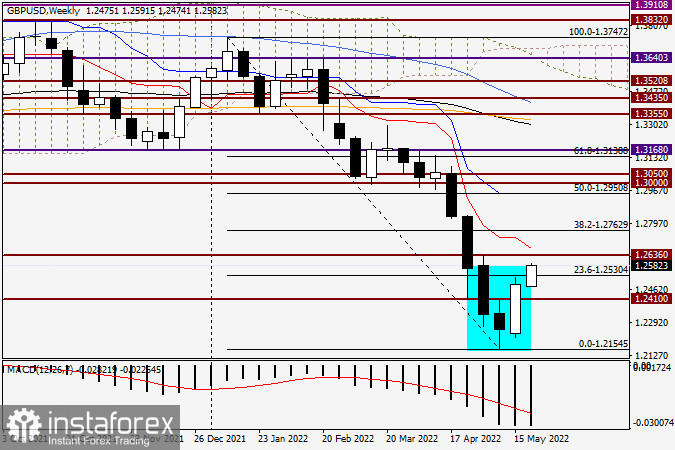
As usual, on Mondays, the results of the previous trading week are analyzed in the first place. So, in the daily time frame, there is a reversal candlestick pattern, which resembles the Morning Star. Although the picture on the chart is not as good, smooth, and beautiful as in books, it is still the same. As a reminder, this pattern consists of three candlesticks with the Star right in the middle. This is the candle of the week before last. In fact, this candlestick came to our attention exactly a week ago. As a rule, when such candlesticks emerge, growth follows. This is exactly what happened. Bulls failed to close the week above the psychological and technical level of 1.2500.
The quote is now above the support level of 1.2410, at which a false breakout occurred. In addition, the pair bounced to the 23.6% retracement level of the Fibonacci grid drawn in the 1.3747-1.2154 range. Should buyers break through 1.2500 and the Fibo level, targets will stand at 1.2600, 1.2636, 1.2673, and another important mark of 1.2700. The bearish move may extend after a true breakout of support at 1.2154. There is a high likelihood of a bullish reversal. The pond has been bearish for too long. So, taking into account the Morning Star reversal pattern, it could be the right time to recoup losses.
Daily
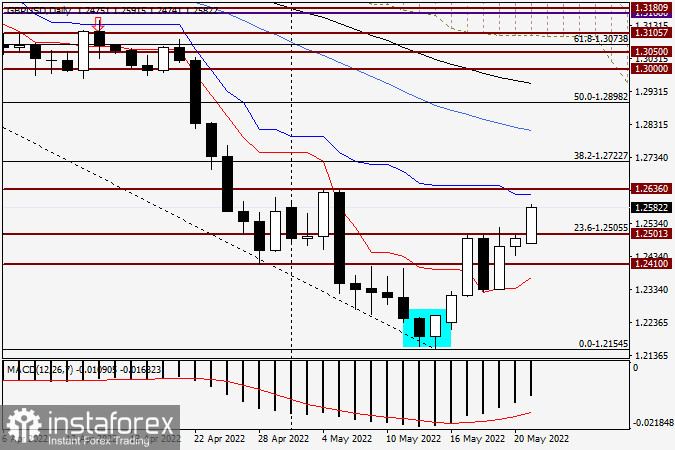
On the daily chart, the pair started to grow after the two highlighted candlesticks, signaling bullish engulfing, had formed. The pair broke the red Tenkan line of the Ichimoku indicator easily and then encountered strong resistance in the 1.2500-1.2523 range. Bulls have attempted to test this zone for 4 days in a row. Such persistence can indicate that the barrier will eventually be broken. If so, long positions could be considered on a bounce to 1.2525-1.2500 or after a brief pullback to 1.2440/45. Meanwhile, it is important to be extra careful when it comes to selling the asset as bulls could trigger a rally. However, if candlesticks begin to make sell signals below 1.2520 or at around 1.2600, going long could be possible. Since the pair is analyzed on a daily basis, there is always time to make some adjustments to the outlook.
Have a nice trading week!


