


I would like to stress that the situation I described in my previous review on the USD/CHF pair has come true or has just started to happen. I am talking about an impressive drop in the pair when the price exceeds the parity level, namely the key psychological and historical level of 1.0000. Thus, we can see that history repeats itself.
Weekly chart
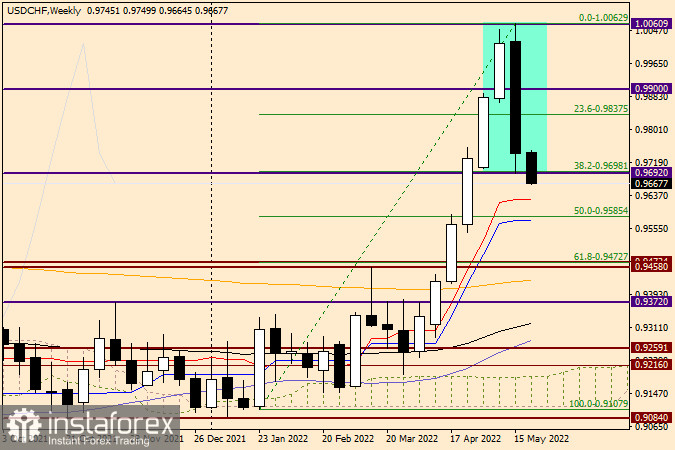
A huge bearish candlestick appeared on the daily chart last week. It swallowed the previous bullish candlestick. Such an impressive bearish engulfing most likely indicates the end of the bullish trend and the start of the bearish one. Judging by the last weekly candlestick, such a deep drop in USD/CHF was not just a correction. Apparently, the market is not ready to trade above the parity level despite the aggressive approach of the US Federal Reserve and the encouraging state of the US economy.
However, all these factors have already been priced in, and the US dollar has regained losses which is confirmed by strong six-week growth. With such a huge bearish candlestick, the usd/chf bulls will struggle to regain control over the pair. The bearish scenario will most likely continue. It will be confirmed by the price settling below the strong and key technical level of 0.9700 and retesting previous lows at 0.9692. To prove their strength, bears will need to push the price under the red Tenkan line and the blue Kijun line of the Ichimoku Indicator.
Daily chart
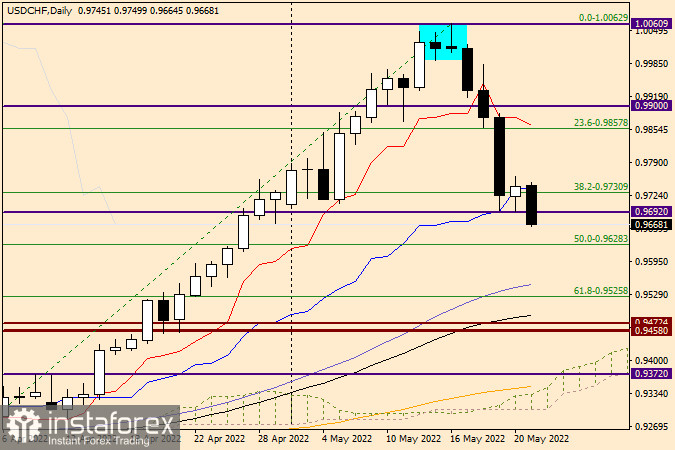
On the daily chart, USD/CHF found support right on the blue Kijun line on May 19 after an extended and strong decline. Then, the quote moved a bit higher on Friday and closed the week at the 38.2 level of the Fibonacci grid stretched between 0.9193-1.0062. The uptrend on Friday looked more like a correction. If this is not the case or the correction goes deeper, the pair may rise to the area of 0.9857- 0.9877. This is where the 23.6 Fibonacci level is located, and the red Tenkan line goes just above it. I think this scenario will be very good for opening short positions. Buying after such a strong decline would be quite risky without a correction. You could also consider sales at lower levels near 0.9765, 0.9800, and 0.9820. As for buying the pair, I recommend waiting until the further trajectory of the instrument becomes clear. Once again, I would like to note that in the week of May 16-20, the dollar/franc pair most likely reversed. Anyway, we will find out the truth only at the end of the week. In the meantime, selling the pair on corrective pullbacks with the above-mentioned targets is the main trading idea for now.
Good luck!


