


Trend analysis
This week, GBP/USD will decline from 1.2626 (closing of the last weekly candle) to the 23.4% retracement level at 1.2543 (dashed blue line), then move to the 38.2% retracement level at 1.2763 (red dotted line). After that it will go down again.
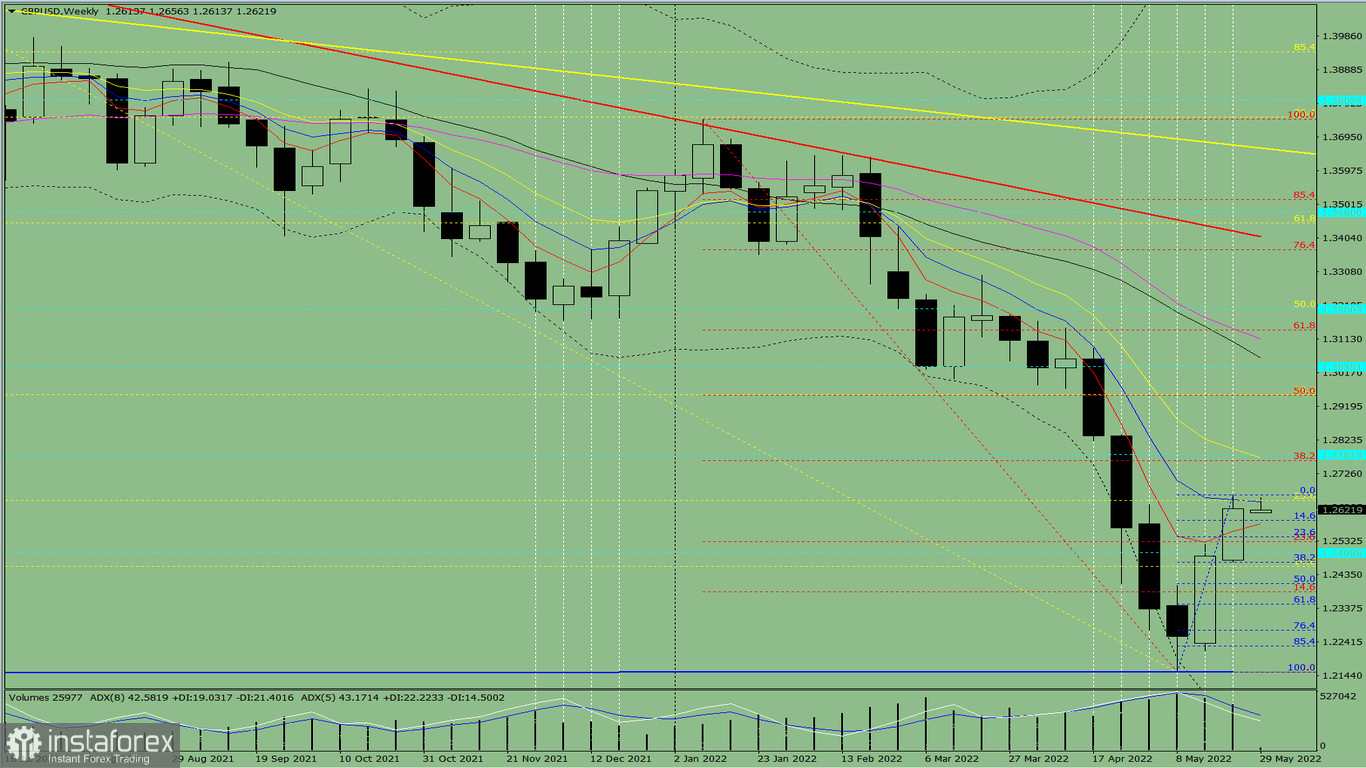
Fig. 1 (weekly chart)
comprehensive analysis:
Indicator analysis - downtrend
Fibonacci levels - downtrend
Volumes - uptrend
Candlestick analysis - uptrend
Trend analysis - uptrend
Bollinger bands - uptrend
Monthly chart - uptrend
All this points to a downward movement in GBP/USD.
Conclusion: The pair will have a downward trend, with no first upper shadow on the weekly black candle (Monday - down) and a second lower shadow (Friday - up).
And during the week, the price will dip from 1.2626 (closing of the last weekly candle) to the 23.4% retracement level at 1.2543 (dashed blue line), move to the 38.2% retracement level at 1.2763 (red dotted line), then go down again.
Alternatively, the pair could fall from 1.2626 (closing of the last weekly candle) to the 14.6% retracement level at 1.2591 (dashed blue line), then bounce up to the 38.2% retracement level at 1.2763 (red dotted line).


