


EUR/USD 5M
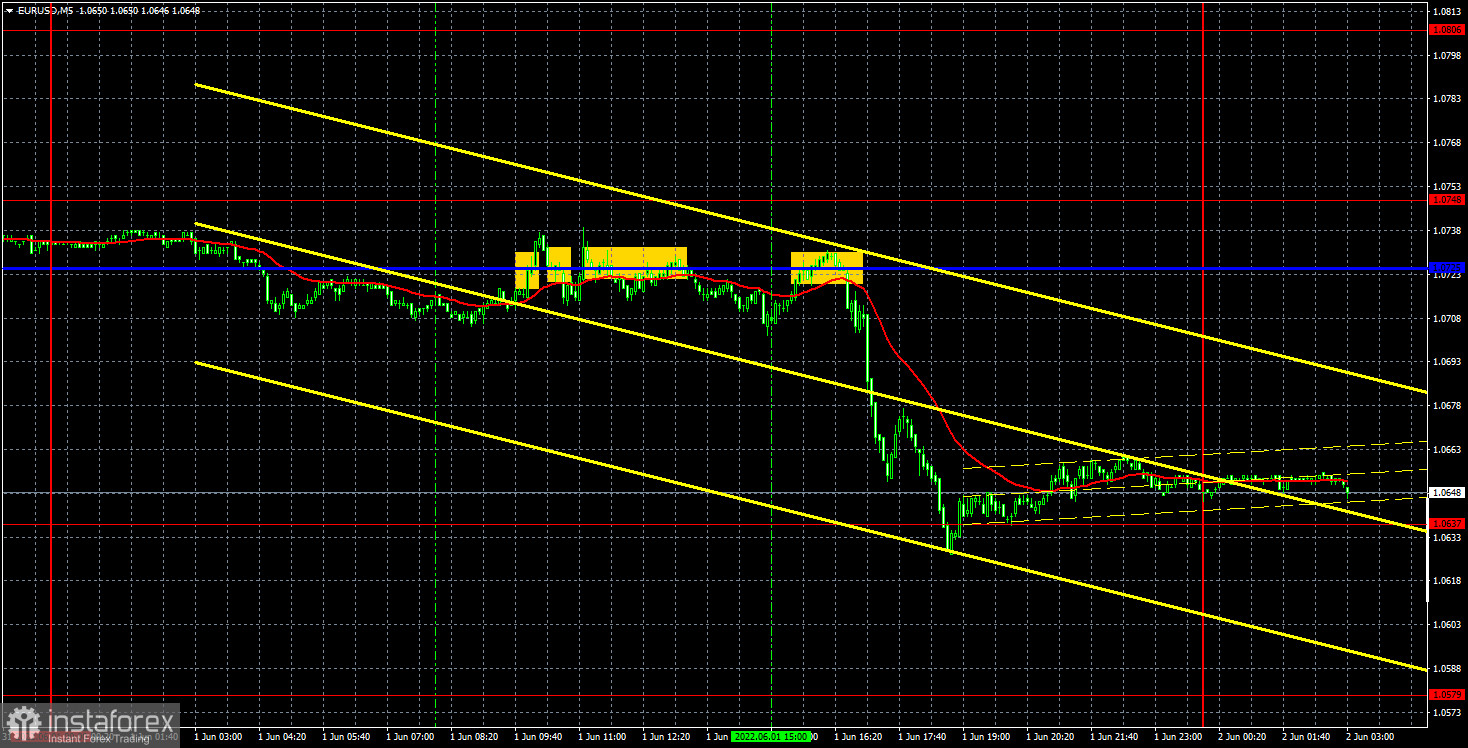
Yesterday, the EUR/USD pair was trading absolutely calmly for most of the day, almost in a flat. This is clearly seen on the 5-minute timeframe, where the price spent the entire European session near the critical line. But at the US trading session, the pair once again bounced off the Kijun-sen line and fell. The pair started to fall with a rebound from Kijun-sen, and at 14-00 GMT several reports were published in America that supported the demand for the US dollar. Strictly speaking, what happened at the previous US session is an exception to the rule. At this time, the indexes of business activity in the manufacturing sectors according to the ISM and S&P versions were published in the US. The first index slightly exceeded the predicted values, and the second one turned out to be slightly weaker than the forecasts. However, after the release of the ISM index, the dollar rose by another 70 points, having risen in price by more than 100 points in the US session alone. The ISM index is, of course, a more important index than the S&P, but to provoke such a strong reaction at a generally quite average value??? This happens extremely rarely, and we believe that either the market was already preparing for new short positions on the pair and was just waiting for a trigger, or such a movement is just an accident.
Yesterday's trading signals were quite weak, since they all formed at a time when the pair was in a flat. All signals formed near the critical line. The first one was for long positions, all subsequent ones were for shorts. Therefore, formally, traders could open only two positions. The long position closed at a loss, but the short position made a very good profit as the price reached its nearest target level of 1.0637. Therefore, a total of 60 points could be earned.
COT report:
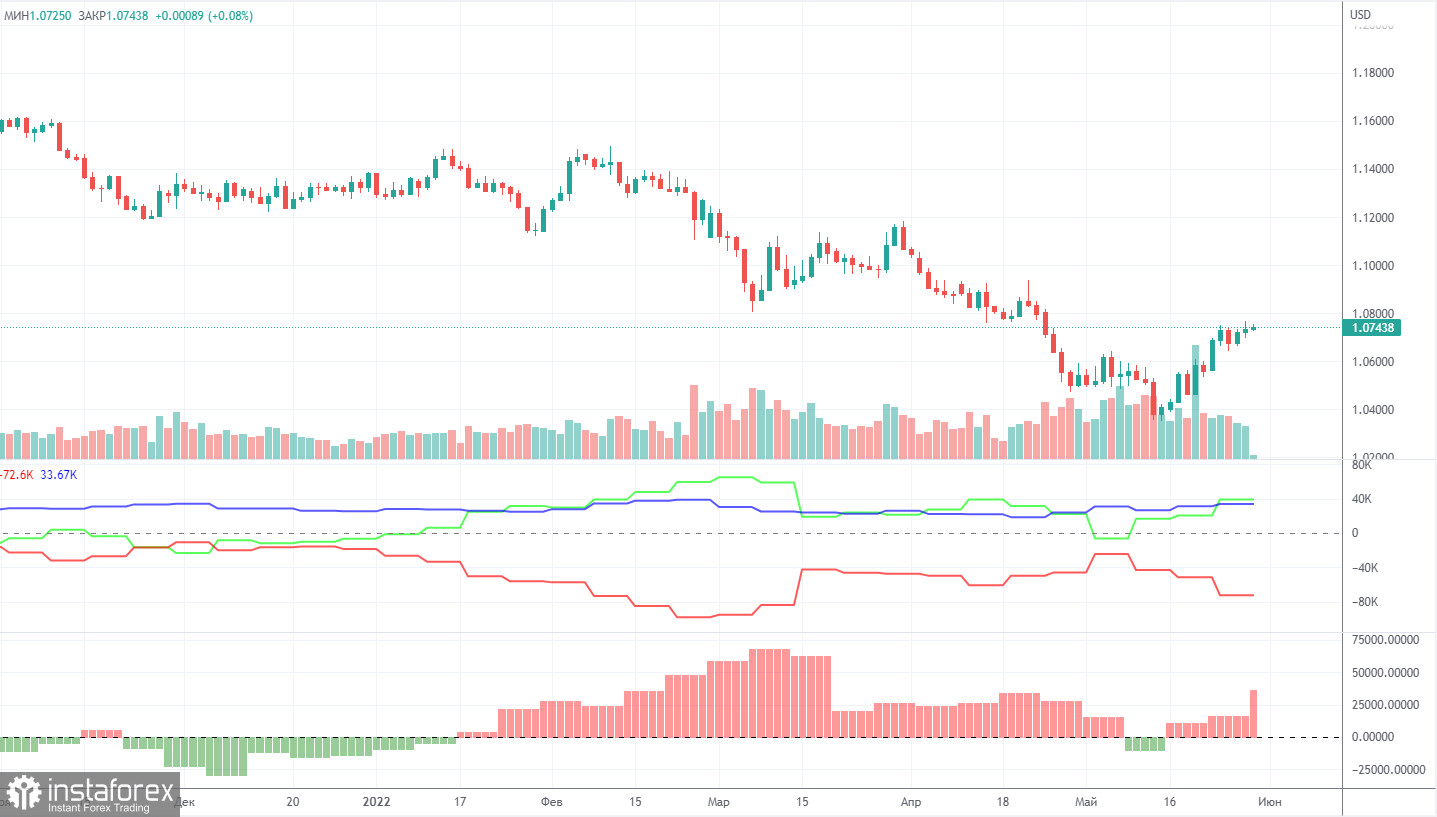
The latest Commitment of Traders (COT) reports on the euro raised a lot of questions. Recall that in the past few months, they showed a blatant bullish mood of professional players, but the euro fell all the time. Now the situation has begun to change, but not at the expense of the market players themselves, but due to the fact that the euro has begun to grow. That is, the mood of traders remains bullish (according to COT reports), and the euro began to grow due to the fact that it needs to be corrected from time to time. During the reporting week, the number of long positions increased by 6,300, while the number of shorts in the non-commercial group decreased by 12,200. Thus, the net position grew by 18,500 contracts per week. The number of long positions exceeds the number of short positions for non-commercial traders by 40,000 already. From our point of view, this happens because the demand for the US dollar remains much higher than the demand for the euro. Now a certain "respite" has begun for the euro, but this does not mean that tomorrow the global downward trend will not resume, and the data from COT reports will not continue to contradict the real state of things on the market. We therefore believe that such reporting data still cannot be relied upon for forecasting. At this time, both on the 4-hour timeframe and on the hourly there are clear trends, trend lines, and channels that indicate where the pair will move next. It is better to rely on them when making trading decisions.
We recommend to familiarize yourself with:
Overview of the EUR/USD pair. June 2. The sixth package of sanctions from the EU has been introduced, Hungary continues to persist.
Overview of the GBP/USD pair. June 2. The British central bank will no longer rush to raise rates. "Brothers" euro and pound.
Forecast and trading signals for GBP/USD on June 2. Detailed analysis of the movement of the pair and trading transactions.
EUR/USD 1H
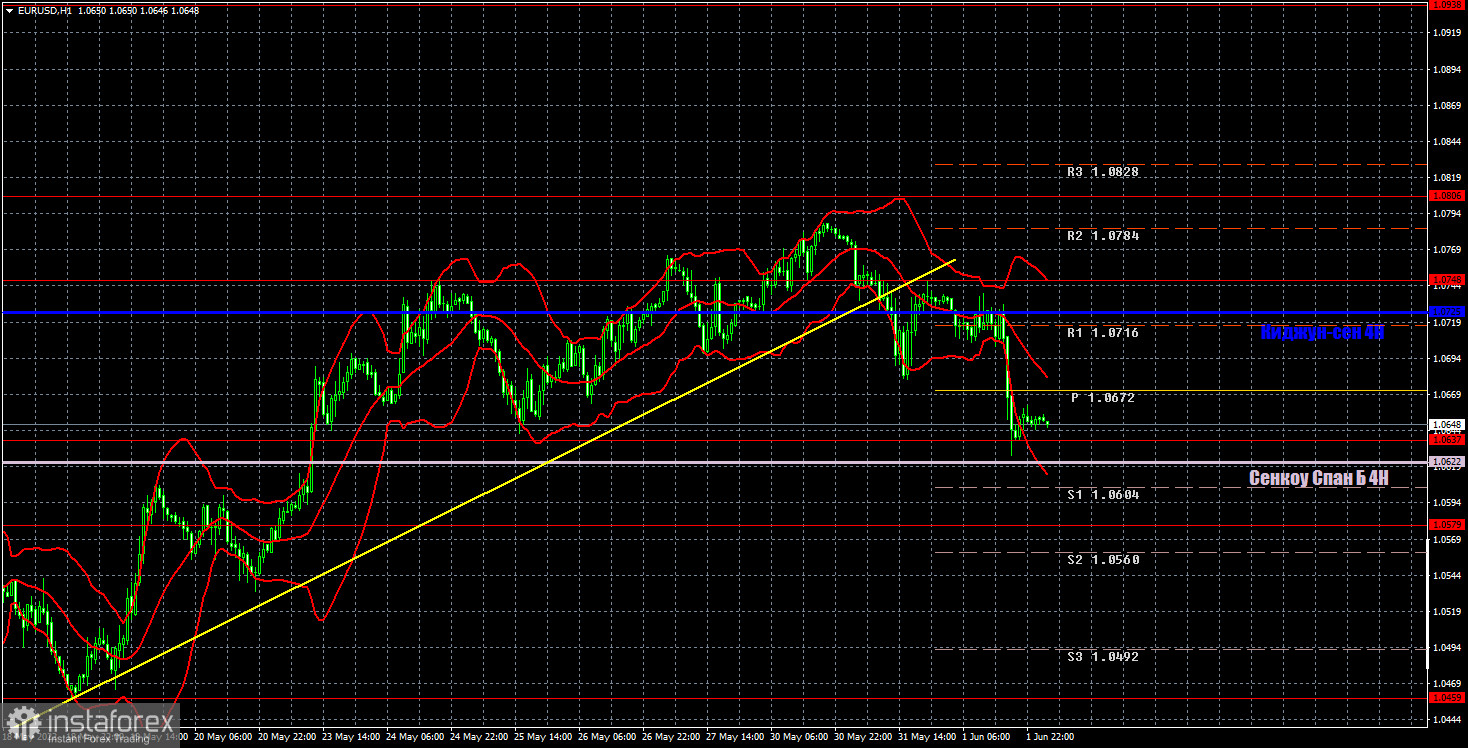
It is clearly seen on the hourly timeframe that the price has settled below the trend line, so the upward trend is formally over. Yesterday we thought about whether the euro will be able to resume the fall, and whether the market will want to sell the euro again. As it turned out a little later, the answer immediately gave an answer. Moreover, such a strong decline was not fully justified from a foundation perspective. Today we highlight the following levels for trading - 1.0459, 1.0579, 1.0637, 1.0748, 1.0806, as well as Senkou Span B (1.0622) and Kijun-sen (1.0725). Ichimoku indicator lines can move during the day, which should be taken into account when determining trading signals. There are also secondary support and resistance levels, but no signals are formed near them. Signals can be "rebounds" and "breakthrough" extreme levels and lines. Do not forget about placing a Stop Loss order at breakeven if the price has gone in the right direction for 15 points. This will protect you against possible losses if the signal turns out to be false. No important events or publications scheduled for June 2 in the European Union. Meanwhile, we only have a report from ADP on changes in the number of employees in the private sector in the US. We believe that there should not be a reaction to this report, but yesterday there should not have been a reaction to the ISM report either. The market now seems to have tuned in to new strong shorts on the pair.
Explanations for the chart:
Support and Resistance Levels are the levels that serve as targets when buying or selling the pair. You can place Take Profit near these levels.
Kijun-sen and Senkou Span B lines are lines of the Ichimoku indicator transferred to the hourly timeframe from the 4-hour one.
Support and resistance areas are areas from which the price has repeatedly rebounded off.
Yellow lines are trend lines, trend channels and any other technical patterns.
Indicator 1 on the COT charts is the size of the net position of each category of traders.
Indicator 2 on the COT charts is the size of the net position for the non-commercial group.


