


GBP/USD 5M
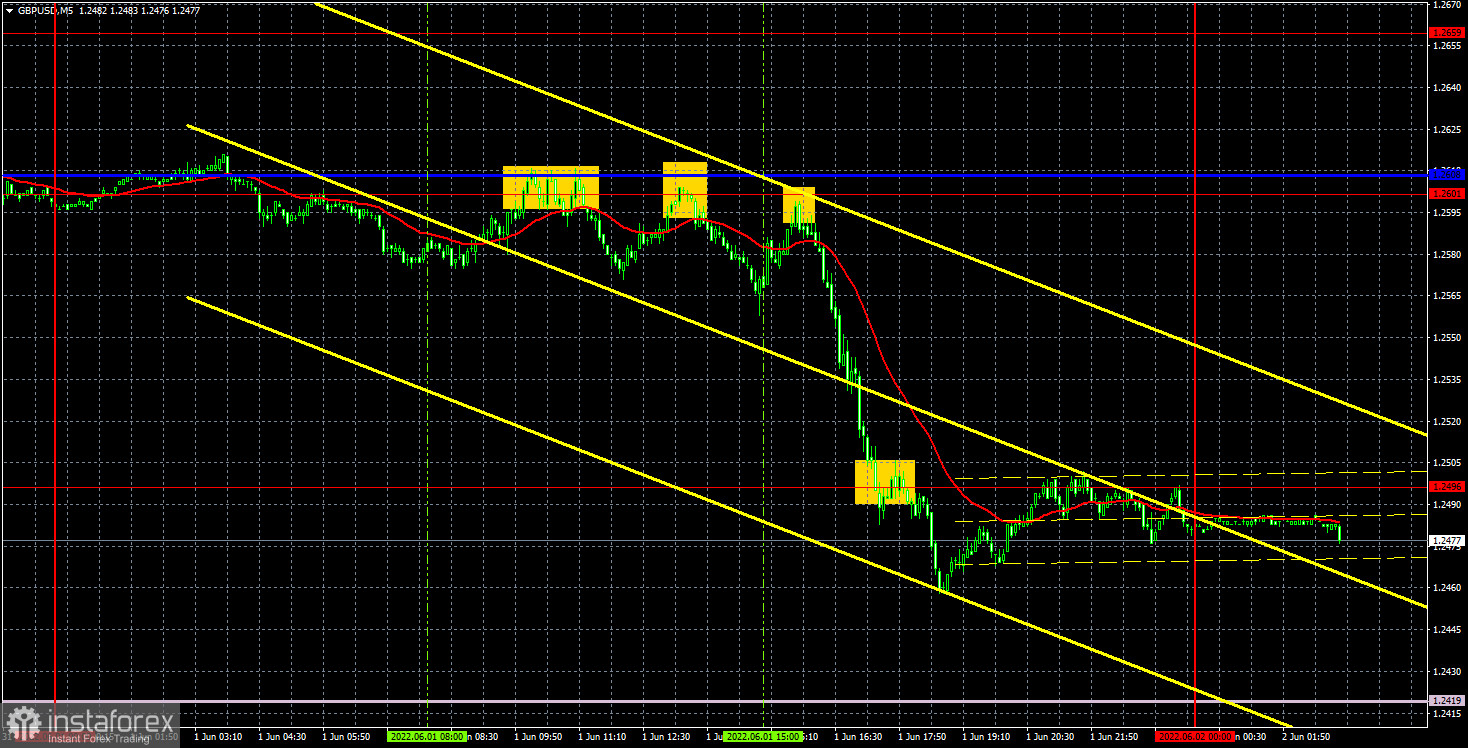
The GBP/USD currency pair also collapsed. But, if very inaccurate trading signals were formed for the euro/dollar pair, then there were good signals for the pound/dollar pair. In principle, the pound's movement during the day was almost identical to the euro's movement. We have already drawn your attention to this moment in our fundamental articles. We also said that now the movement of both major pairs depends more on the US dollar than on the euro or pound. That is why we see such a strong growth of the dollar in the US session on Wednesday, and not in the European one. Of course, relatively important business activity indices were published in the US, but we recall that such indices are published twice a month and never provoke a movement of 80-100 points. Yesterday the pound fell by 60 points to the ISM index and by 100 after. In general, now the technical picture looks as if the market was already preparing for new powerful long positions on the US dollar.
Returning to the trading signals, the first three were formed near the critical line and the extreme level of 1.2601. We draw your attention to the fact that the Kijun-sen line rose to 1.2608 and formed an area with a level of 1.2601 during the day. It was from this area that the price bounced three times, allowing traders to open a short position. It is noteworthy that for each transaction Stop Loss had to be set to breakeven, and for the first two transactions it worked. Nevertheless, it was still impossible to call the signals false, since the pair did not even attempt to settle above the critical line. Consequently, it was possible to work out the third sell signal, which brought the main profit to traders. A sell signal was also formed near the level of 1.2496, which the price easily and simply overcame. Therefore, profits could have been received yesterday at least 100 points.
COT report:
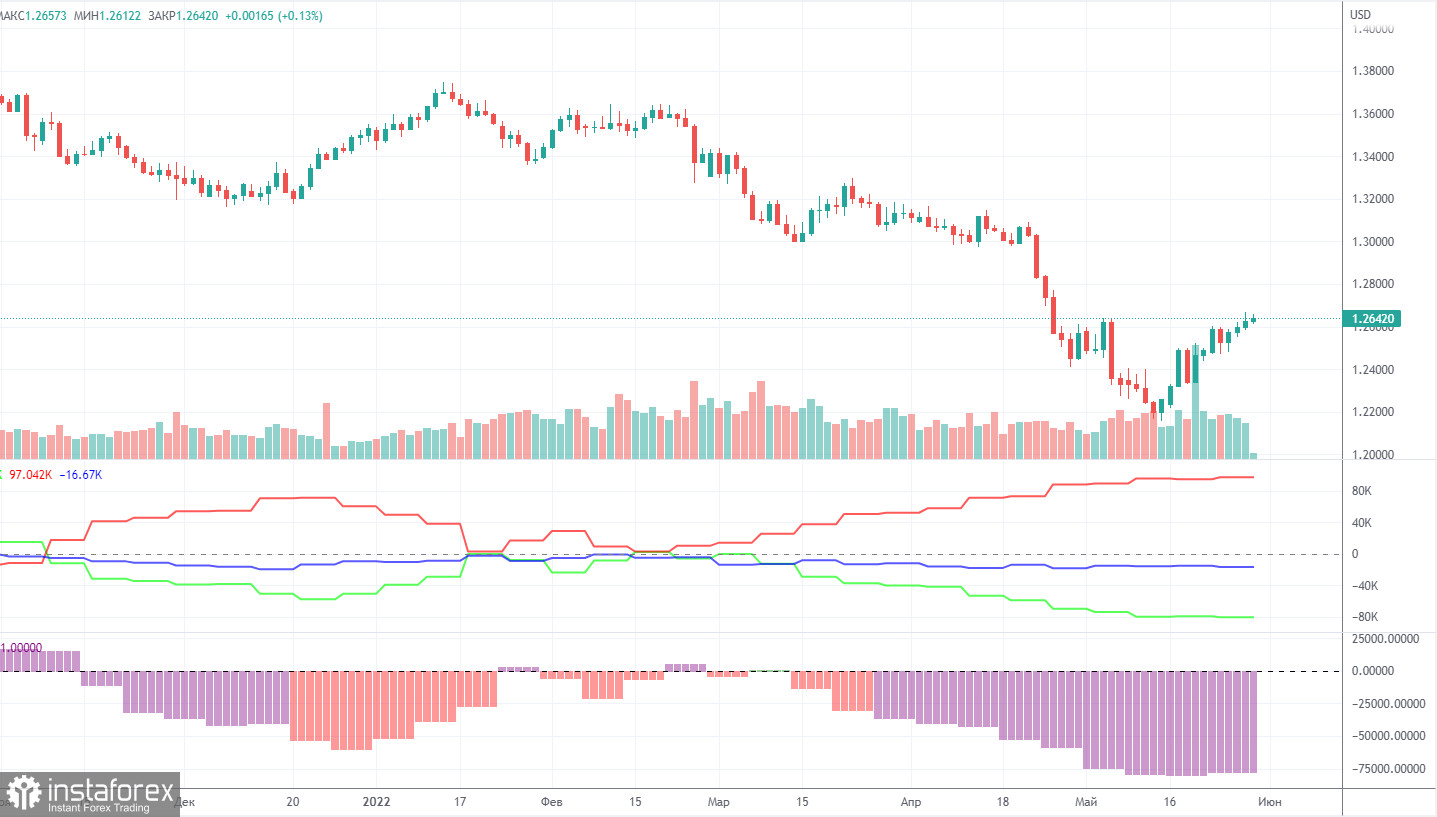
The latest Commitment of Traders (COT) report on the British pound showed almost no change. During the week, the non-commercial group closed 700 long positions and opened 500 shorts. Thus, the net position of non-commercial traders decreased by only 1,200. The net position has been falling for three months already, which is perfectly visualized by the green line of the first indicator in the chart above or the histogram of the second indicator. The non-commercial group has already opened a total of 106,000 shorts and only 26,000 longs. Thus, the difference between these numbers is already more than four times. This means that the mood among professional traders is now "pronounced bearish". Note that in the case of the pound, the COT report data very accurately reflects what is happening in the market: the mood of traders is "very bearish", and the pound has been falling against the US dollar for a very long time. In the last two weeks, the pound has started rising, but even in the chart for this paragraph (daily timeframe), this movement looks very weak so far. Since in the case of the pound, the COT report data reflects the real picture of things, we note that a strong divergence of the red and green lines of the first indicator often means the end of the trend. Therefore, now you can really count on a new upward trend. And since the euro and the pound are very often traded in the same way, you can count on an upward trend for the euro. Of course, if the geopolitics or the foundation does not continue to deteriorate.
We recommend to familiarize yourself with:
Overview of the EUR/USD pair. June 2. The sixth package of sanctions from the EU has been introduced, Hungary continues to persist.
Overview of the GBP/USD pair. June 2. The British central bank will no longer rush to raise rates. "Brothers" euro and pound.
Forecast and trading signals for EUR/USD on June 2. Detailed analysis of the movement of the pair and trading transactions.
GBP/USD 1H
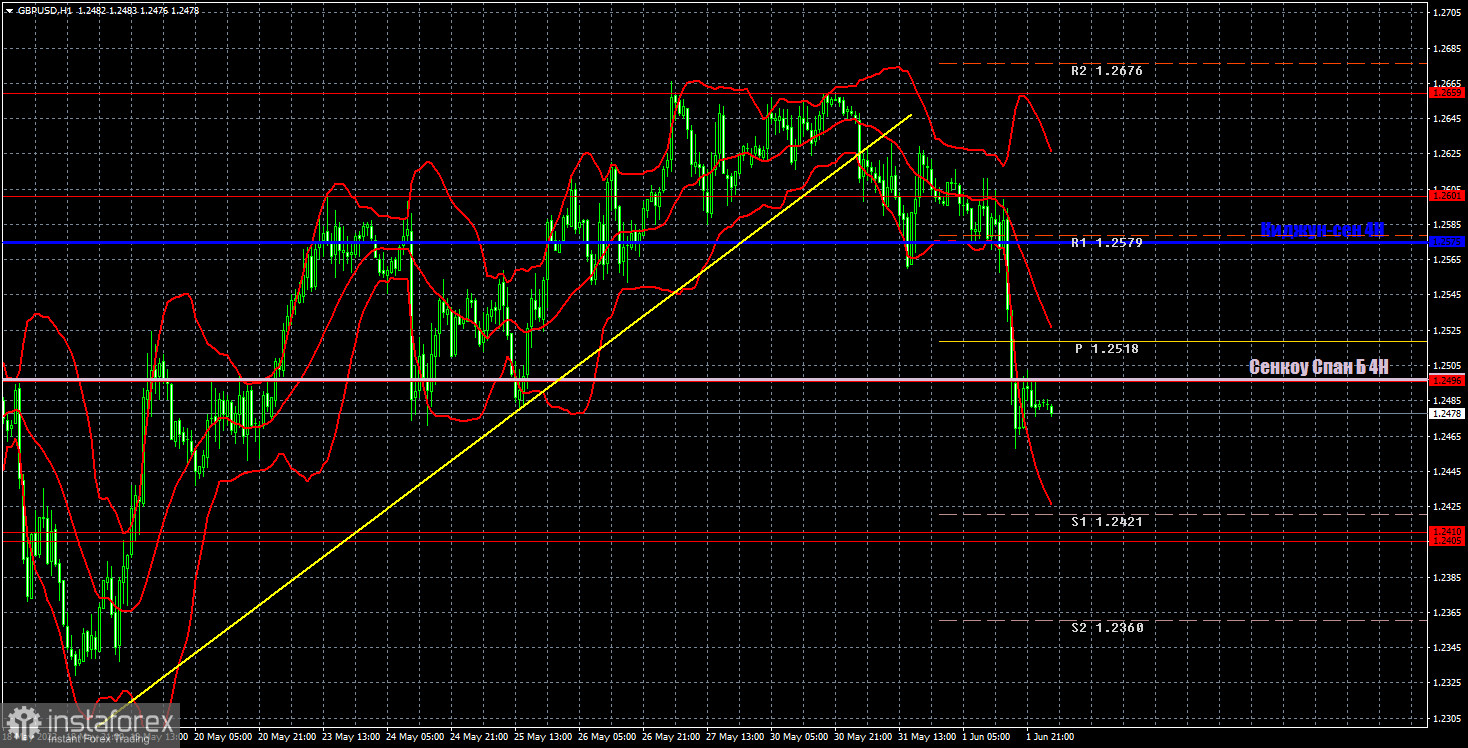
Yesterday the pair has continued its downward movement on the hourly timeframe, so now overcoming the ascending trend line does not raise any doubts about its relevance. The upward trend is now completely canceled, and the British currency can move towards updating its 2-year lows, to which 300 points are currently left to go. Today we highlight the following important levels: 1.2259, 1.2405-1.2410, 1.2496, 1.2601, 1.2659. Senkou Span B (1.2497) and Kijun-sen (1.2575) lines can also be sources of signals. Signals can be "rebounds" and "breakthroughs" of these levels and lines. The Stop Loss level is recommended to be set to breakeven when the price passes in the right direction by 20 points. Ichimoku indicator lines can move during the day, which should be taken into account when determining trading signals. The chart also contains support and resistance levels that can be used to take profits on trades. There are no major events or publications scheduled for Thursday in the UK. Meanwhile, the ADP report on the number of employees in the private sector will be released in the US, which could theoretically provoke a new growth of the dollar. Moreover, traders are now clearly tuned in to new large-scale long positions on the US currency.
Explanations for the chart:
Support and Resistance Levels are the levels that serve as targets when buying or selling the pair. You can place Take Profit near these levels.
Kijun-sen and Senkou Span B lines are lines of the Ichimoku indicator transferred to the hourly timeframe from the 4-hour one.
Support and resistance areas are areas from which the price has repeatedly rebounded off.
Yellow lines are trend lines, trend channels and any other technical patterns.
Indicator 1 on the COT charts is the size of the net position of each category of traders.
Indicator 2 on the COT charts is the size of the net position for the non-commercial group.


