


Yesterday, traders received only one sell signal. Let us take a look at the 5-minute chart to find out what happened. Earlier, I asked you to pay attention to the level of 1.0739 to decide when to enter the market. The first attempt to reach 1.0739 was unsuccessful. Some time later, bulls started opening long positions in response to the eurozone manufacturing PMI report. As a result, the pair jumped to 1.0739. A false break of this level provided traders with a sell signal. Thus, by the beginning of the US trade, the euro/dollar pair broke the support level and slid deeper to 1.0646. As a result, holders of short positions earned more than 100 pips. However, sellers failed to enter the market at 1.0690 due to the absence of an upward test of the level.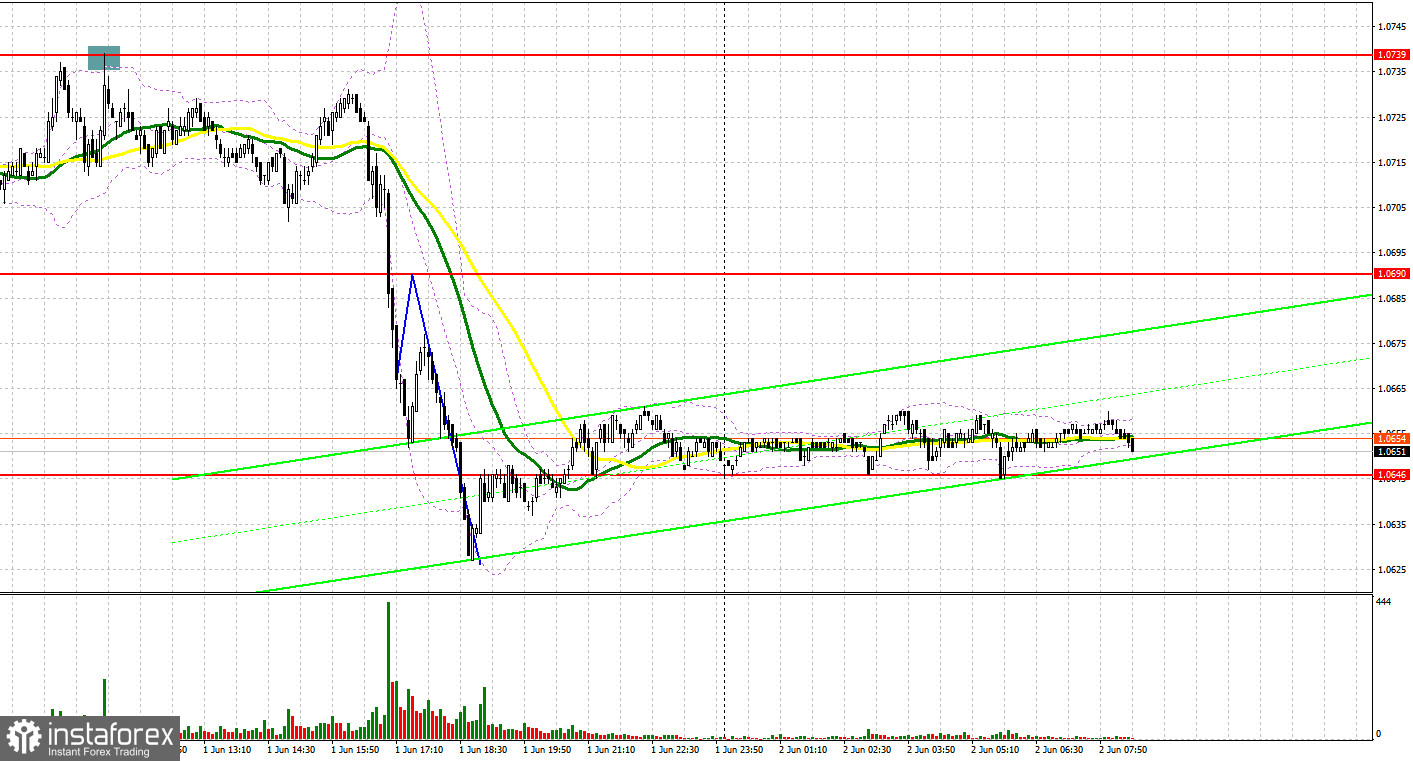
Conditions for opening long positions on EUR/USD:
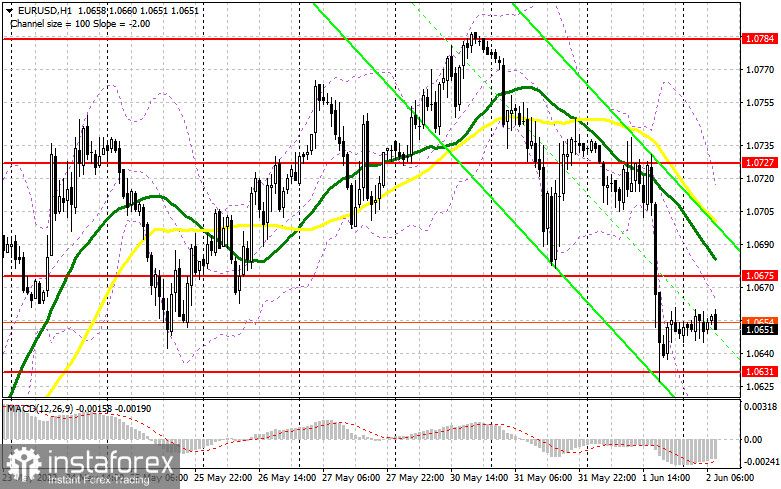
Data on the US manufacturing PMI surprised many investors. In addition, the Fed announced the necessity to switch to a more aggressive policy. Against the backdrop, the euro/dollar pair slumped. Now, we see that the downtrend, which began on May 13, may return with new forces. However, buyers still have a chance to recoup losses. Today, the eurozone is going to disclose only the PPI data. The indicator may hit a new high. Notably, some economists foresee a decline. If the pair drops amid the report, only a false break of 1.0631, this week's low, will give a long signal with the target at 1.0675. There, we see moving averages that may cap the upward potential. A break and a downward test of this level will seriously affect sellers' stop orders. A downward test of this area will give a new long signal, allowing the pair to climb to a new high of 1.0727. The pair will hardly increase to the farther target at 1.0784 amid the bearish market sentiment and mounting demand for the greenback, boosted by investors' concerns about inflation growth. If the euro/dollar pair decreases and buyers fail to protect 1.0631, pressure on the euro will surge. If sellers manage to cause execution of buyers' stop orders, expecting a deeper correction, the pair may slide to 1.0596. That is why it is better to go long after a false break of this level. It is also possible to buy the asset from the level of 1.0561 or lower – from 1.0511, expecting a rise of 30-35 pips within one day.
Conditions for opening short positions on EUR/USD:
Sellers continue controlling the market. Now, they have to protect the nearest resistance level of 1.0675. Weak data from the eurozone and a surge in producer prices will hardly surprise traders, but pressure on the euro will surely rise, helping sellers to protect 1.0675. A false break of this level may give a first sell signal with the target at 1.0631. A break and settlement below this level as well as an upward test of this level will give an additional sell signal with the target at 1.0596. However, it is better to avoid opening sell orders from the lows. If the pair breaks and fixes below 1.0631 and does not show a fast drop, it will be wise to avoid sell orders. If the euro continues falling, the next target will be located at 1.0521, where it is recommended to close short positions. The pair will be able to hit this level only in the second part of the day amid stronger bearish sentiment. If the euro/dollar pair increases during the European session and bears fail to protect 1.0675, bulls may get a chance to regain control over the market. In this case, the uptrend will be resumed. Against the backdrop, it will be better to go short after a false break of 1.0727. It is also possible to sell the asset from the monthly high of 1.0784 and higher – from 1.0811, expecting a drop of 30-35 pips.
COT report
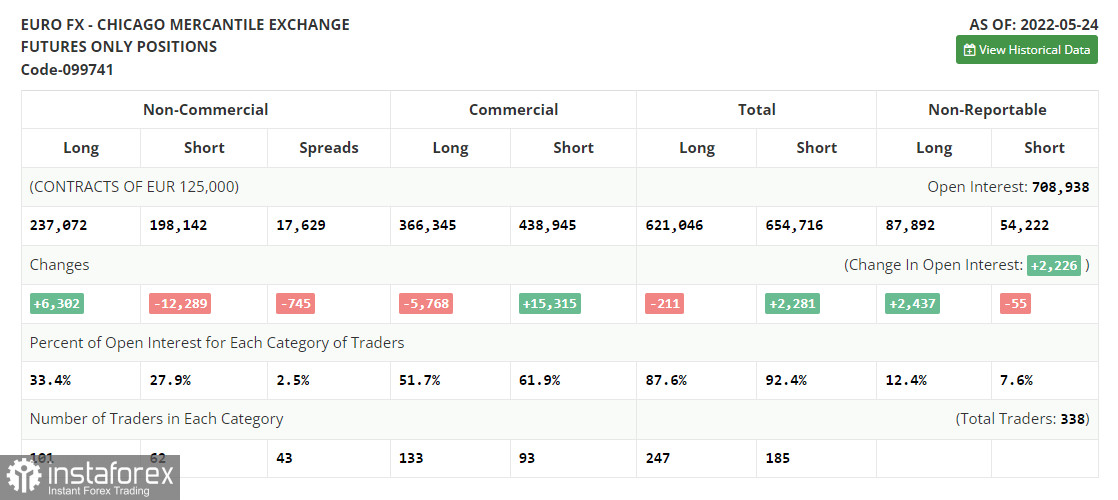
According to the COT report from May 24, the number of long positions advanced, whereas the number of short positions dropped. Traders continued opening long positions, expecting a more aggressive monetary policy from the ECB. Although last week, there were less comments about a key interest rate hike in the near future, the euro/dollar pair managed to retain its upward potential. Now, analysts suppose that the ECB will raise the deposit rate by one-fourth of a basis point as early as July. The next two hikes will take place in September and December. By the end of the year, the benchmark rate is expected to be at the level of 0.25%. However, some experts are sure that the central bank will have to take more aggressive measures. A lot depends on the inflation report for May of this year. The indicator may jump to 7.7% on a yearly basis, thus increasing pressure on politicians. Against the backdrop, the regulator may raise the key interest rate up to 0.5% from the current zero level. The COT report unveiled that the number of long non-commercial positions increased by 6,302 to 237,072 from 230,770, while the number of short non-commercial positions declined by 12,289 to 198,142 from 210,431. The euro's low price is making the currency more attractive for mid-term traders. According to the weekly results, the total non-commercial net position increased to 38,930 from 20,339. The weekly close price jumped to 1.0734 from 1.0556.
Signals of indicators:
Moving Averages
Trading is performed below 30- and 50-day moving averages, thus pointing to a possible continuation of the downward movement.
Note: The period and prices of moving averages are considered by the author on the one-hour chart that differs from the general definition of the classic daily moving averages on the daily chart.
Bollinger Bands
In case of a decline, the lower limit of the indicator located at 1.0615 will act as support. If the pair grows, the resistance level will be located at the higher limit of the indicator at 1.0705..
Description of indicators- Moving average (moving average, determines the current trend by smoothing volatility and noise). The period is 50. It is marked in yellow on the chart.
- Moving average (moving average, determines the current trend by smoothing volatility and noise). The period is 30. It is marked in green on the graph.
- MACD indicator (Moving Average Convergence/Divergence - convergence/divergence of moving averages). A fast EMA period is 12. A slow EMA period is 26. The SMA period is 9.
- Bollinger Bands. The period is 20.
- Non-profit speculative traders are individual traders, hedge funds, and large institutions that use the futures market for speculative purposes and meet certain requirements.
- Long non-commercial positions is a total number of long positions opened by non-commercial traders.
- Short non-commercial positions is a total number of short positions opened by non-commercial traders.
- The total non-commercial net position is a difference in the number of short and long positions opened by non-commercial traders.


