


For the AUD /USD currency pair, the downward dynamics prevailed at the auction on June 6-10 and were quite strong. The main technical prerequisite for such a movement of the quote, in my personal opinion, was the too long upper shadow of the previous candle, which exposed the problems of the players to increase the rate relative to the further rise of the quote.
Weekly
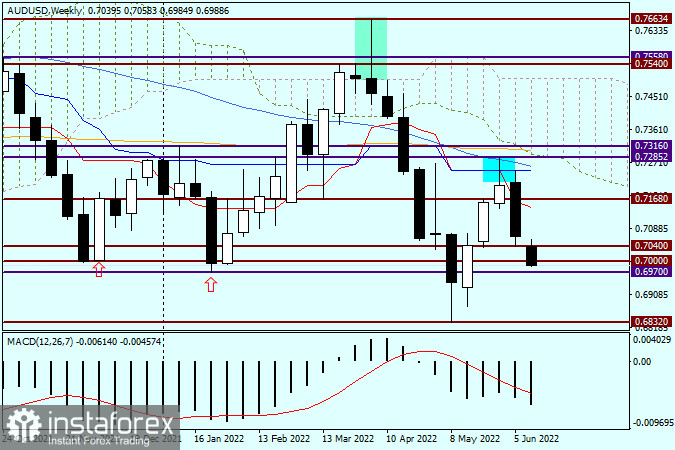
In my materials, I repeatedly pay the most direct attention to the shadows of candles, especially at older time intervals, since they very often give strong signals regarding the subsequent direction of the course. So, looking at the weekly candle of the week before last, we note the achievement of maximum values at a strong technical level of 0.7285, as well as failed attempts to break through the red Tenkan line and the blue Kijun line of the Ichimoku indicator. By the way, the Tenkan is already turning downwards with might and mainly following the price, which also does not bode well for bulls on the "Aussie". It is impossible to ignore the 50 simple moving average, which also took an active part as resistance and contributed to the decline that we observed during the trading of the past five days. Last week, the decline began immediately after the meeting of the quote with the blue Kijun line, and this is very clearly visible on the weekly price chart. During the downward dynamics, the pair dropped to a strong technical level of 0.7040, where it quite predictably found strong support and rebounded, closing trading on June 6-10 at 0.7067.
This week's session started again with the bears' pressure on AUD/USD, and at the time of writing this article, the pair is already trading near the landmark psychological, historical, and technical level of 0.7000. I dare to assume that a confident closing of the current weekly trading under this most important level for the market will indicate the subsequent bearish prospects of this trading instrument, the main goal of which may be the support level of 0.6832, where the minimum values of last month were shown. At the same time, please note that the strong price zone 0.7000-0.6970 repeatedly stopped the decline of the quote and sent the rate up. For greater clarity, I showed this by putting the arrows up. How it will be this time will become clear after the Fed decides on interest rates and the press conference of the head of this department Jerome Powell. Let me remind you that these events will take place on Wednesday evening, that is, the day after tomorrow.
Daily
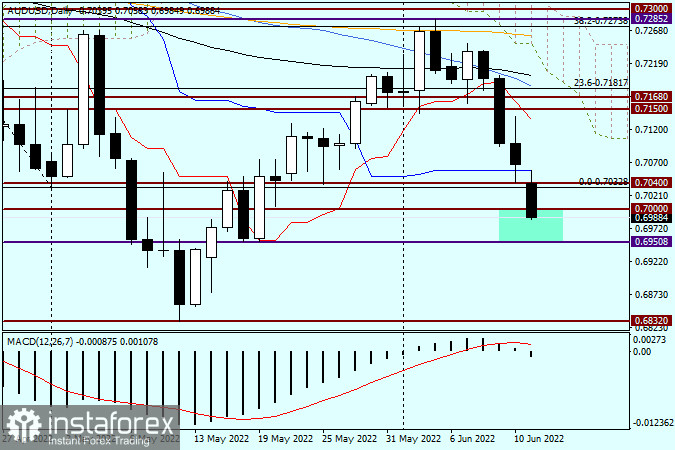
Looking at the daily chart of the "Aussie", it should not escape attention that today's trading opened with a small bearish gap, which they tried to close, but they could not do it until the end because of the strong resistance that the blue Kijun line had. It is clear what efforts the players are facing to lower the exchange rate, trying to lower the AUD/USD trades below the iconic 0.7000 mark. On the daily chart, taking into account the minimum values shown at the auction on May 18-19, the support zone is represented as 0.7000-0.6950. If a bullish reversal pattern of candle analysis appears in this price area, and even with a closing price above 0.7000, this can be perceived as a signal to open long positions. In the case of a true breakdown of the 0.6950 level, with mandatory consolidation under this mark, it is already worth thinking about sales on the rollback to it.


