


EUR/USD 5M
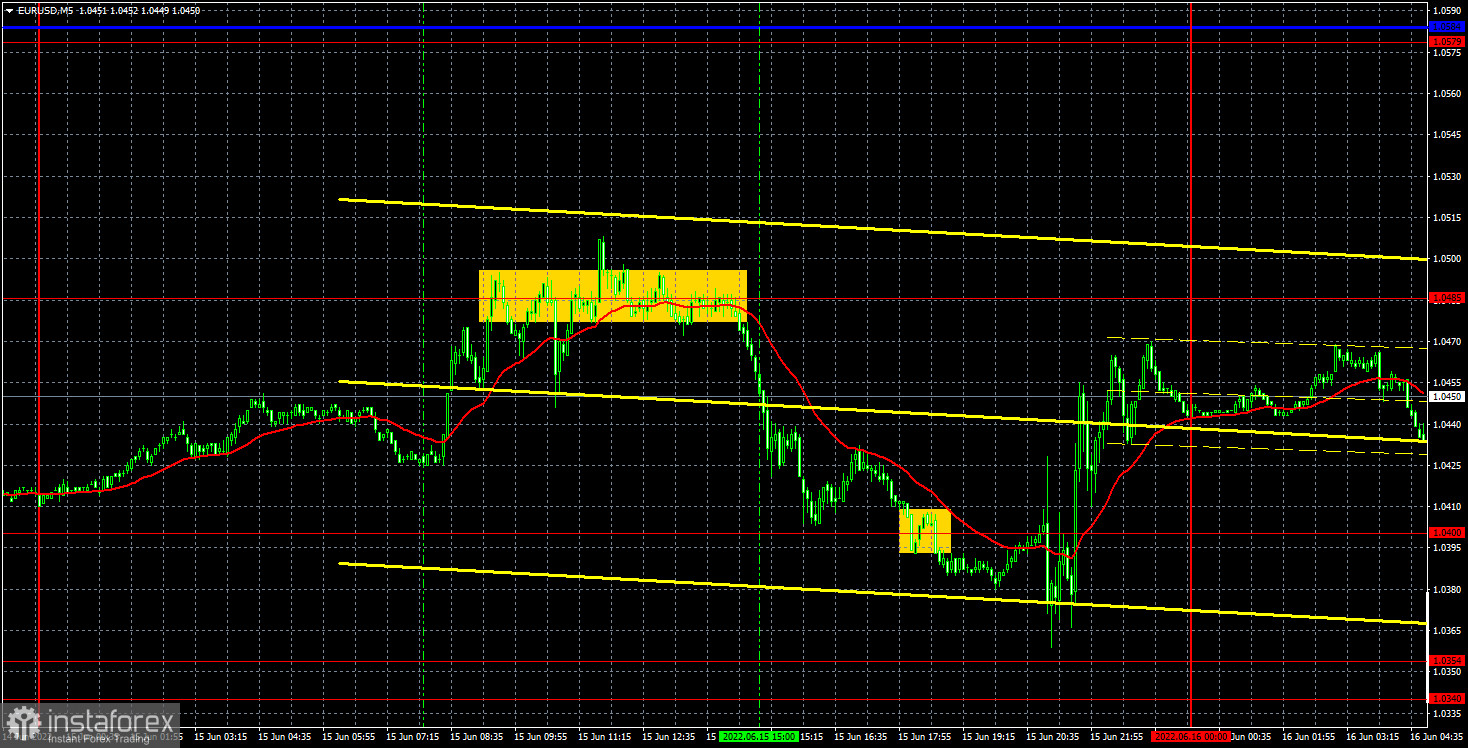
The EUR/USD pair showed all possible options for movement on Wednesday. We observed an upward movement during the day, a flat, a downward movement, a "swing". Thus, it was very difficult to trade the pair yesterday. Of course, such movements from the pair were primarily associated with the Federal Reserve meeting and its results, the announcement of which was scheduled for the evening. It was evident that the market has not yet decided what it will do with various options for raising the rate. It was clear that the market had no idea what decision the Fed would make. And the Fed eventually decided to raise the key rate immediately by 0.75%. Recall that initially the most likely scenario was an increase of 0.5%, but this week the probability of a higher increase has risen significantly, as reported by Barclays, in particular. But why then did the dollar fall and not rise? Initially, it was just growing, the fall began after Fed Chairman Jerome Powell began his speech at a press conference. So it's all Powell's fault? Also no, his rhetoric was hawkish. Yesterday, we just once again saw a not entirely logical reaction of the market. The US dollar can easily return to its 20-year highs by today.
As for trading signals, it would be better not to have them. In the evening, for obvious reasons, it was not necessary to open trading positions, and the pair was trading along the extreme level of 1.0485 at the European trading session. Bounces were made from this level, overcoming, in general, a typical flat, which was also difficult to identify, since it was an intraday flat. As a result, traders could open one or two deals in this place, which eventually brought a loss. However, there are often completely illogical and complex movements on the day of the Fed meeting.
COT report:
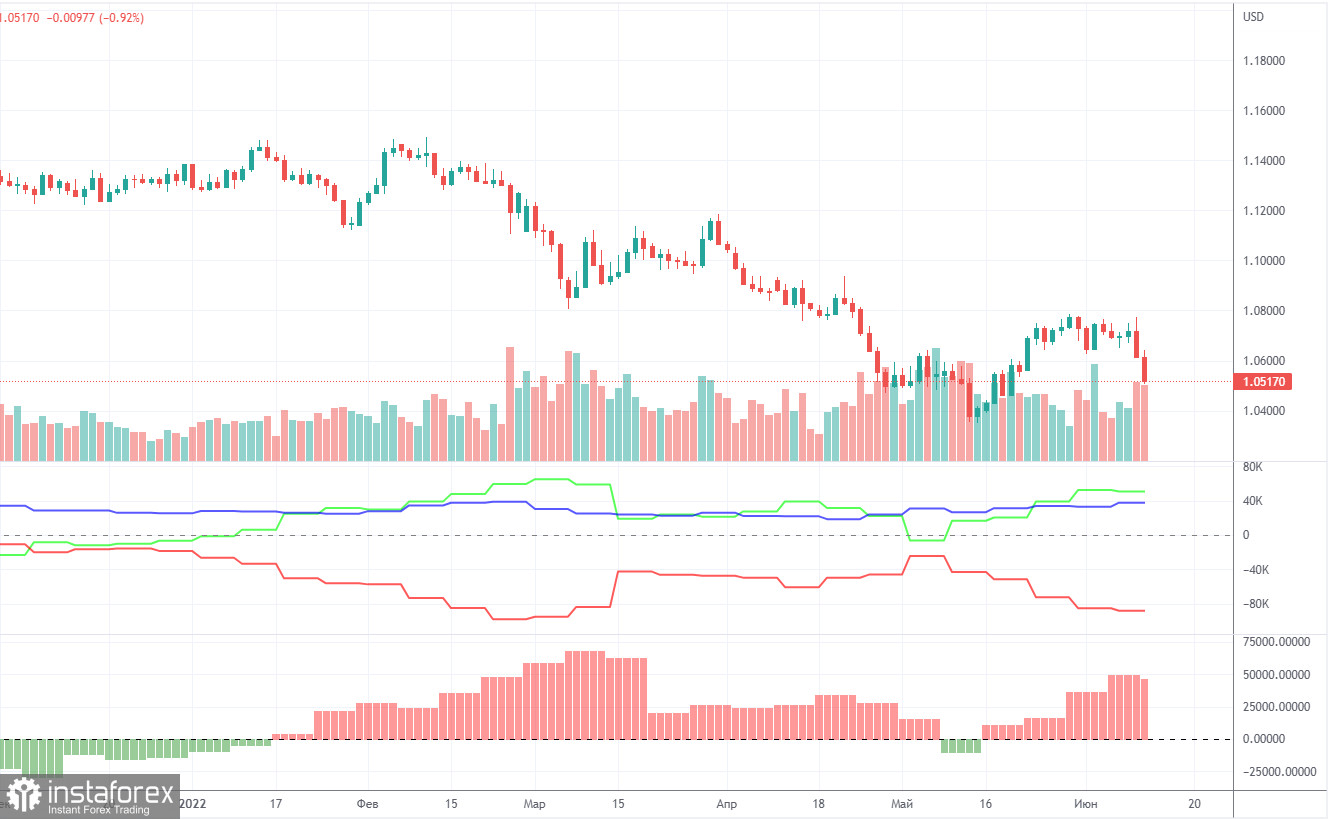
The latest Commitment of Traders (COT) reports on the euro raised a lot of questions. Recall that in the past few months, they showed a blatant bullish mood of professional players, but the euro fell all the time. At this time, the situation has not changed. The euro tried to show growth, but last week it collapsed. Therefore, we again have a situation in which the mood of the major players is bullish, but the euro is falling. The number of long positions decreased by 6,300 during the reporting week, and the number of shorts in the non-commercial group decreased by 4,500. Thus, the net position decreased by 1,800 contracts per week. The number of long positions exceeds the number of shorts for non-commercial traders by 50,000. The second indicator in the chart above perfectly shows that the net position has been positive for a long time, and the pair's movement chart in the same chart shows a downward movement. From our point of view, this happens because the demand for the US dollar remains much higher than the demand for the euro . The "respite" for the euro, which has been observed in recent weeks, did not last long, and the global downward trend remains in force. Therefore, we believe that the data of COT reports on the euro still cannot be relied upon when predicting the future movement of the euro/dollar pair.
We recommend to familiarize yourself with:
Overview of the EUR/USD pair. June 16. The euro's hope is a new technical correction.
Overview of the GBP/USD pair. June 16. Bank of England meeting - will it save the pound?
Forecast and trading signals for GBP/USD on June 16. Detailed analysis of the movement of the pair and trading transactions.
EUR/USD 1H
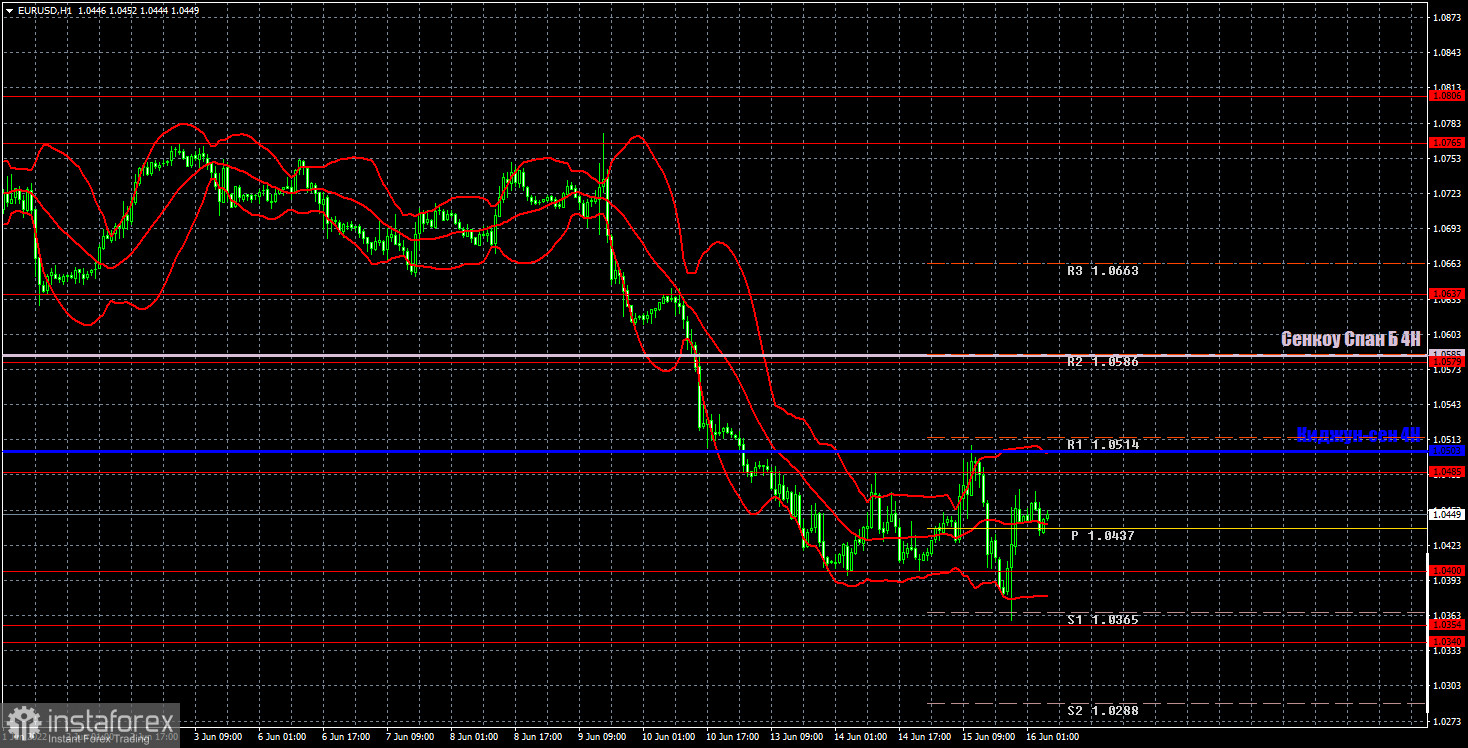
Nothing has changed on the hourly timeframe since yesterday. In total, the pair rose by "as much as" 30 points on Wednesday. There were very volatile movements during the day, and in different directions, which only confused all the cards. The euro has risen in price within the day, not so much to qualify for a new upward correction, and the dollar has not grown at all, but the downward trend continues, which means that the US currency can safely continue to grow. Today, we highlight the following levels for trading - 1.0340-1.0354, 1.0400, 1.0485, 1.0579, 1.0637, as well as Senkou Span B (1.0585) and Kijun-sen (1 .0503). Ichimoku indicator lines can move during the day, which should be taken into account when determining trading signals. There are also secondary support and resistance levels, but no signals are formed near them. Signals can be "rebounds" and "breakthrough" extreme levels and lines. Do not forget about placing a Stop Loss order at breakeven if the price has gone in the right direction for 15 points. This will protect you against possible losses if the signal turns out to be false. No important event or report in the European Union and the United States. However, with the opening of Europe, the development of yesterday's results of the Fed meeting may continue. That is, today, movements can also be volatile and in different directions.
Explanations for the chart:
Support and Resistance Levels are the levels that serve as targets when buying or selling the pair. You can place Take Profit near these levels.
Kijun-sen and Senkou Span B lines are lines of the Ichimoku indicator transferred to the hourly timeframe from the 4-hour one.
Support and resistance areas are areas from which the price has repeatedly rebounded off.
Yellow lines are trend lines, trend channels and any other technical patterns.
Indicator 1 on the COT charts is the size of the net position of each category of traders.
Indicator 2 on the COT charts is the size of the net position for the non-commercial group.


