


GBP/USD 5M
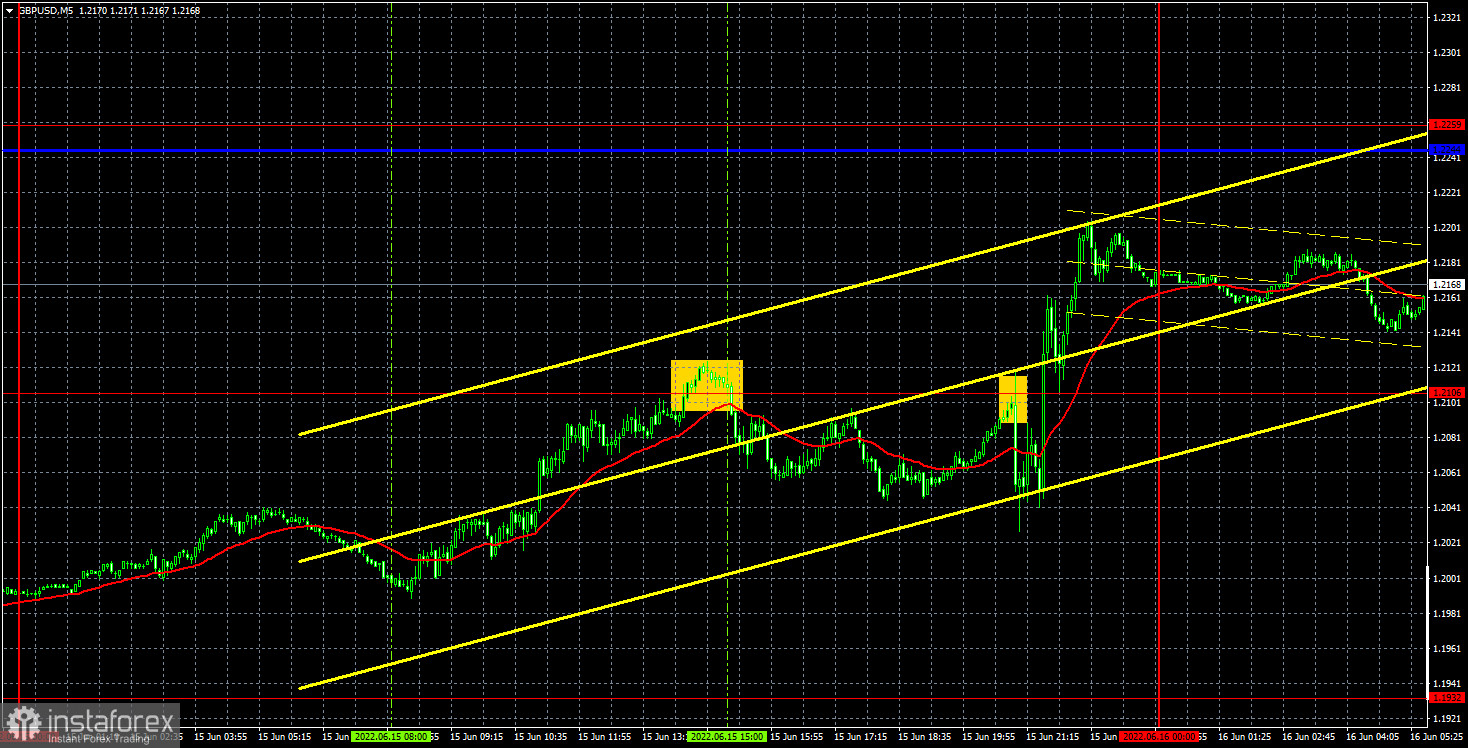
The GBP/USD currency pair moved much better than the EUR/USD pair on Wednesday. In principle, the entire movement can be clearly divided into European and US sessions. The pound grew on the first, and decreased on the second. And then the results of the Federal Reserve meeting were announced. The rate was raised by 0.75%, and Fed Chairman Jerome Powell said that in July the central bank may go for another increase of 0.75%, which is a record for the last 28 years. That is, the US dollar had excellent chances to show a new round of growth, but at the same time, it has already grown very sharply in the last week. We warned that the market may have already worked off any rate hike. Therefore, the dollar's decline immediately after the meeting could happen, firstly, a consequence of the fact that the Fed's decision was worked out by traders in advance, and secondly, it may be an illogical market reaction that will be offset today. Recall that this is not the first case when the price moves completely in the wrong direction, which is expected from it. Over the past week, the pound has lost about 600 points on absolutely ordinary reports from the UK. Just as illogical as yesterday's movement.
The first sell signal was formed at the opening of the US trading session. The price rebounded very inaccurately from the extreme level of 1.2106, after which it managed to go down about 45 points. The funny thing is that this signal was false (the target was not achieved), but it was possible to make money on it, since the short position should have been closed before the announcement of the results of the FOMC meeting. And in this case, the profit on it was about 30 points. There were no other signals during the day. It was too late to open deals during Powell's speech.
COT report:
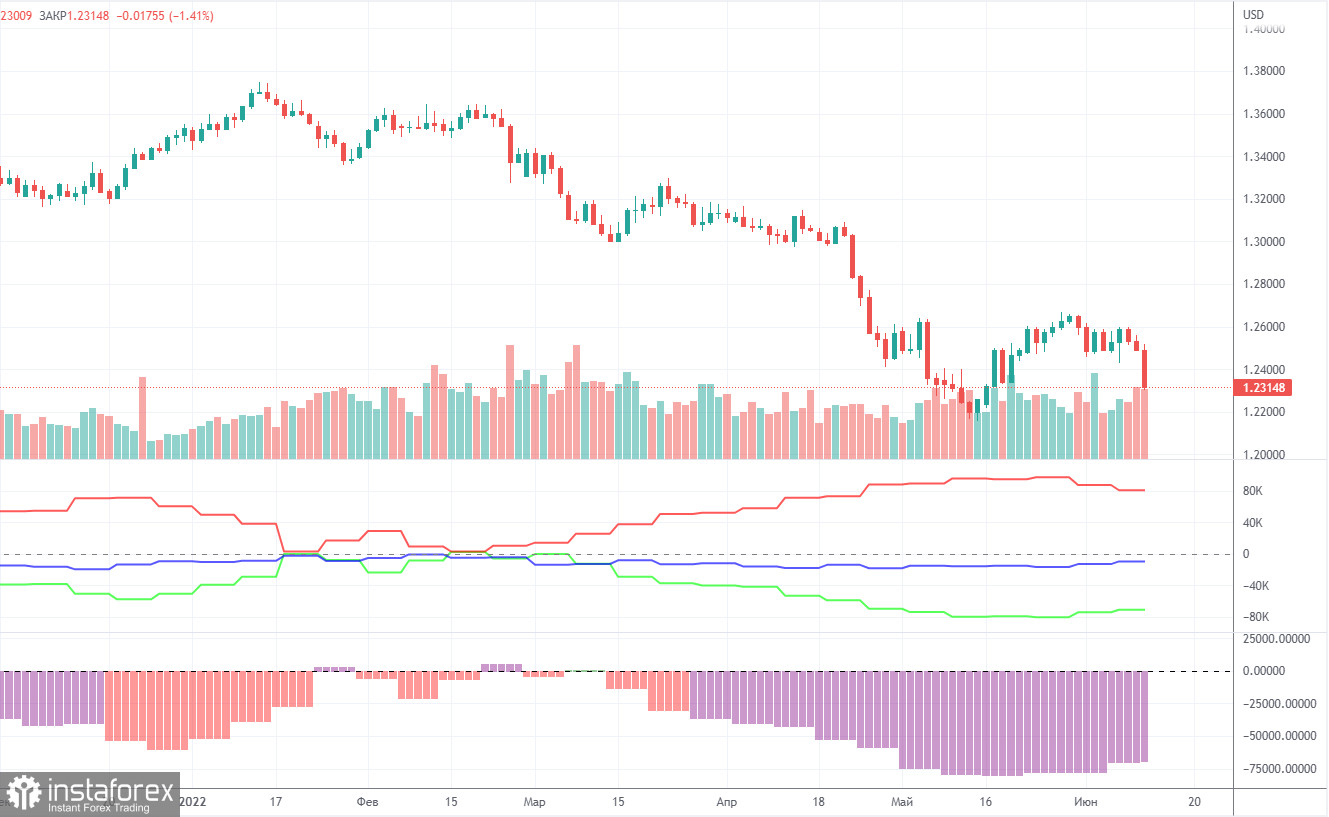
The latest Commitment of Traders (COT) report on the British pound showed insignificant changes. The non-commercial group opened 3,800 long positions and 500 shorts during the week. Thus, the net position of non-commercial traders increased by 3,300. However, the mood of major players still remains "pronounced bearish". And the pound, despite the growth of the net position, still resumed the fall. The net position has been falling for three months, which is perfectly visualized by the green line of the first indicator in the chart above or the histogram of the second indicator. Therefore, two increases in this indicator are unlikely to unambiguously indicate the end of the downward trend for the pound. The non-commercial group has a total of 105,000 shorts open and only 34,000 longs. Thus, the difference between these numbers is more than three times. We note that in the pound's case, the COT report data very accurately reflects what is happening in the market: the mood of traders is "very bearish", and the pound has been falling against the US dollar for a long time. In the past few weeks, the pound has shown growth, but even in the chart for this paragraph (daily timeframe), this movement looks very weak. Since in the pound's case, the COT report data reflects the real picture of things, we note that a strong divergence of the red and green lines of the first indicator often means the end of the trend. Therefore, now we can formally count on a new upward trend. However, weak geopolitical, fundamental and macroeconomic backgrounds for European currencies still put pressure on these currencies.
We recommend to familiarize yourself with:
Overview of the EUR/USD pair. June 16. The euro's hope is a new technical correction.
Overview of the GBP/USD pair. June 16. Bank of England meeting - will it save the pound?
Forecast and trading signals for EUR/USD on June 16. Detailed analysis of the movement of the pair and trading transactions.
GBP/USD 1H
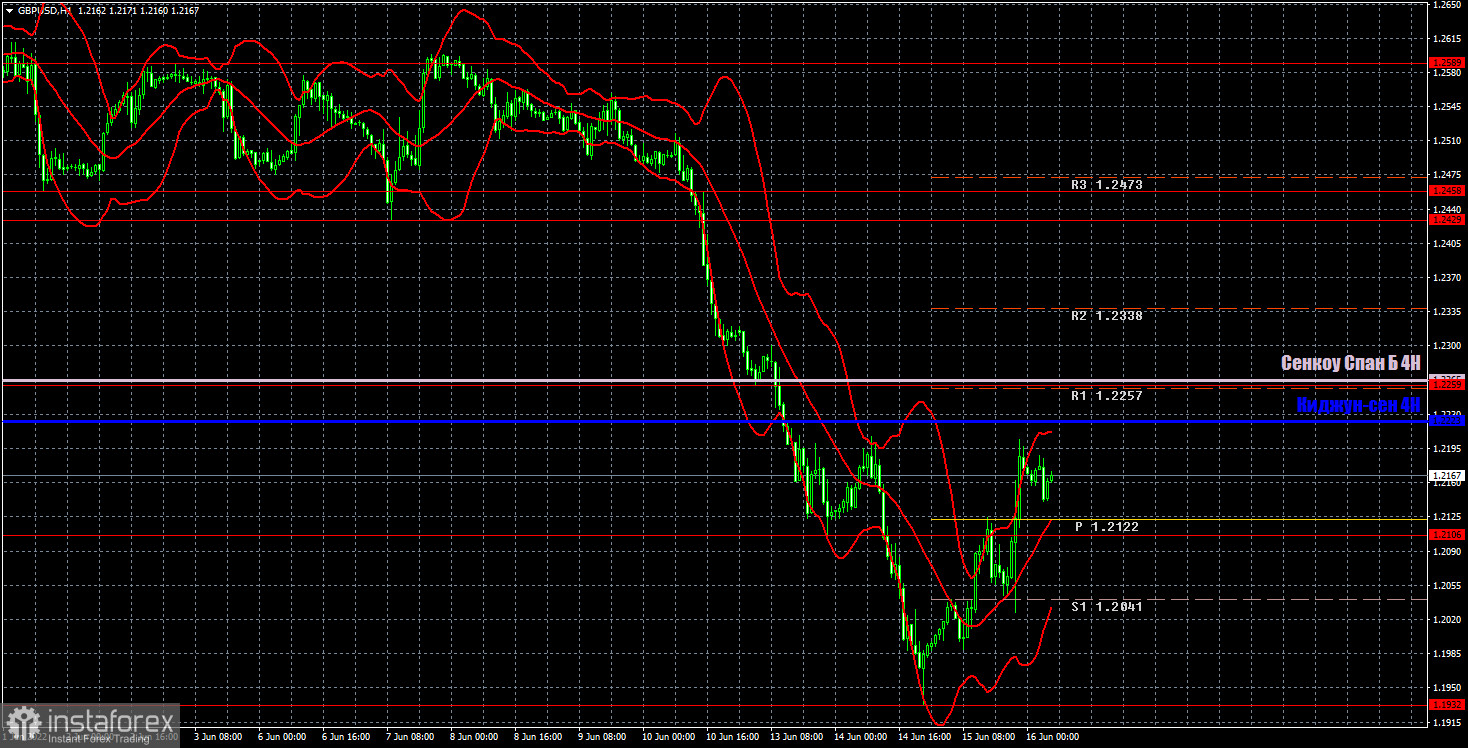
It is not immediately clear on the hourly timeframe that some extra important event took place yesterday. And raising the Fed's rate by 0.75% for the first time in 28 years is an extra important event. However, yesterday's volatility does not stand out at all against the general background. In the last week, the pair passed 150-250 points daily, so yesterday there was just an upward correction from the pound/dollar pair. At the moment, the price is below the critical line, so we can't expect a strong growth from the pound right now. Today, we highlight the following important levels: 1.1932, 1.2106, 1.2259, 1.2429, 1.2458, 1.2589. Senkou Span B (1.2265) and Kijun-sen (1.2223) lines can also be sources of signals. Signals can be "rebounds" and "breakthrough" of these levels and lines. The Stop Loss level is recommended to be set to breakeven when the price passes in the right direction by 20 points. Ichimoku indicator lines can move during the day, which should be taken into account when determining trading signals. The chart also contains support and resistance levels that can be used to take profits on trades. The announcement of the results of the Bank of England meeting is scheduled for Wednesday in the UK, which means that high volatility awaits us again, new "surprises" and it is simply impossible to predict where the pair will end up by tonight.
Explanations for the chart:
Support and Resistance Levels are the levels that serve as targets when buying or selling the pair. You can place Take Profit near these levels.
Kijun-sen and Senkou Span B lines are lines of the Ichimoku indicator transferred to the hourly timeframe from the 4-hour one.
Support and resistance areas are areas from which the price has repeatedly rebounded off.
Yellow lines are trend lines, trend channels and any other technical patterns.
Indicator 1 on the COT charts is the size of the net position of each category of traders.
Indicator 2 on the COT charts is the size of the net position for the non-commercial group.


