


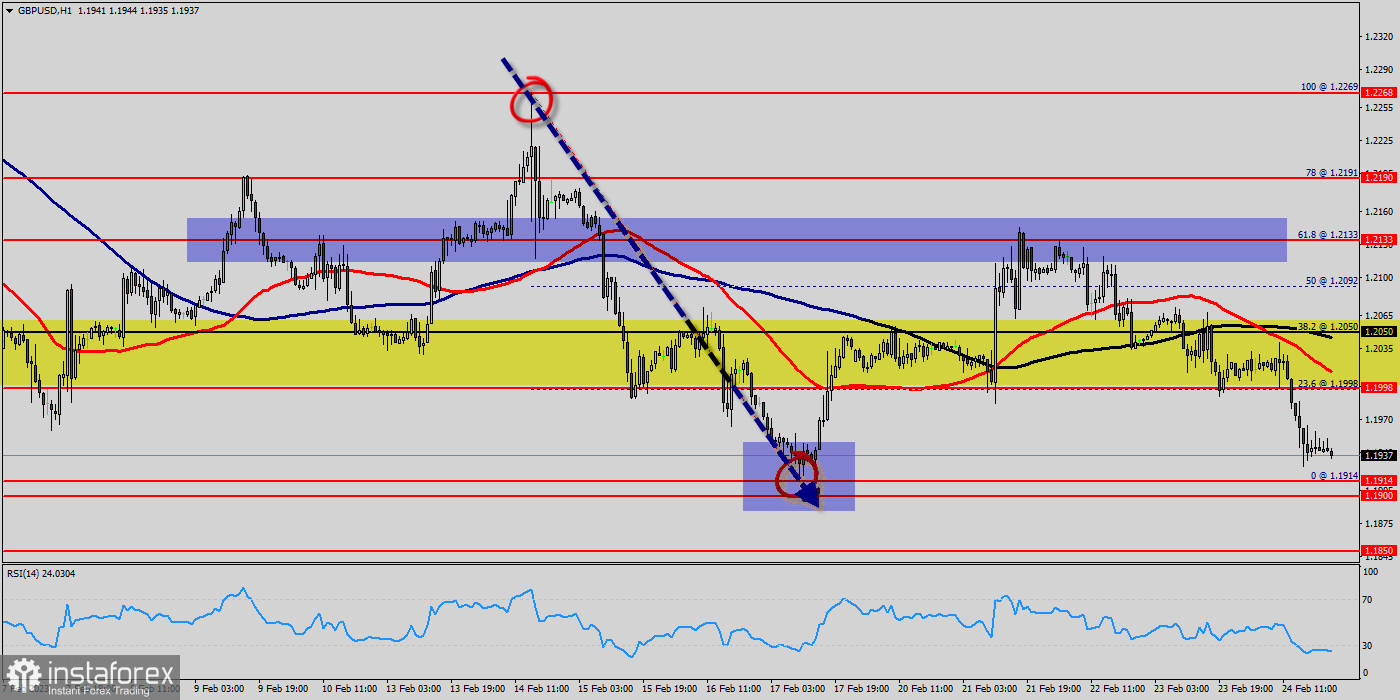
The GBP/USD pair continues moving in a bullish trend from the support levels of 1.1998 and 1.1914. Currently, the price is in a bullish channel. This is confirmed by the RSI indicator signaling that we are still in a bullish trending market. As the price is still above the moving average (100), immediate support is seen at 1.1998, which coincides with a key ratio (23.6% of Fibonacci). Moreover, the RSI starts signaling an upward trend, as the trend is still showing strength above the moving average (100) and (50). Thus, the market is indicating a bearish opportunity below 1.1998. Consequently, the first support is set at the level of 1.1998. So, the market is likely to show signs of a bullish trend around the zone of 1.1998.
Additionally, the price is in a bearish channel now. Amid the previous events, the pair is still in a downtrend. From this point, the GBP/USD pair is continuing in a bullish trend from the new support of 1.1998. Thereupon, the price area of 1.1998 remains a significant support zone. Therefore, a possibility that the GBP/USD pair will haveupside momentum is rather convincing and the structure of a raise does not look corrective. In other words, buy orders are recommended above the key ratio (1.1998) with the first target at the level of 1.2050. Furthermore, if the trend is able to breakout through the first resistance level of 1.2050. We should see the pair climbing towards the double top (1.2092) to test it. It would also be wise to consider where to place a stop loss; this should be set below the second support of 1.1914.
Last review :
Remember that the GBP/USD pair is in donwtrend since a week! so, the GBP/USD pai is really a great fortune. Hence, our target 1.1991 in the next two days.
Today, the GBP/USD pair is trading below the weekly pivot point 1.2099. Because the GBP/USD pair broke support which turned to a minor resistance at the price of 1.2099 last week in 2022. The price of 1.2099 is expected to act as major resistance.
As long as there is no daily close below 1.2099, there are no chances of a fresh increase below 1.2099 (R1) in the H1 time frame. The support levels will be placed at the prices of 1.2099 and 1.1950. As long as there is no daily close below 1.2099, there are chances of breaking the bottom of 1.1950.
The volatility is very high for that the the GBP/USD pair is still moving between 1.2099 and 1.1950 in coming hours. As a result, the market is likely to show signs of a bullish trend again. Hence, it will be good to sell below the level of 1.2099 with the first target at 1.1950 and further to 1.1900 in order to test the weekly last bearish wave.
However, if the GBP/USD is able to break out the daily resistance at 1.2099, the market will rise further to 1.2164 to approach resistance 2 in coming days.


