


Analysis of Tuesday's deals:
30M chart of the GBP/USD pair
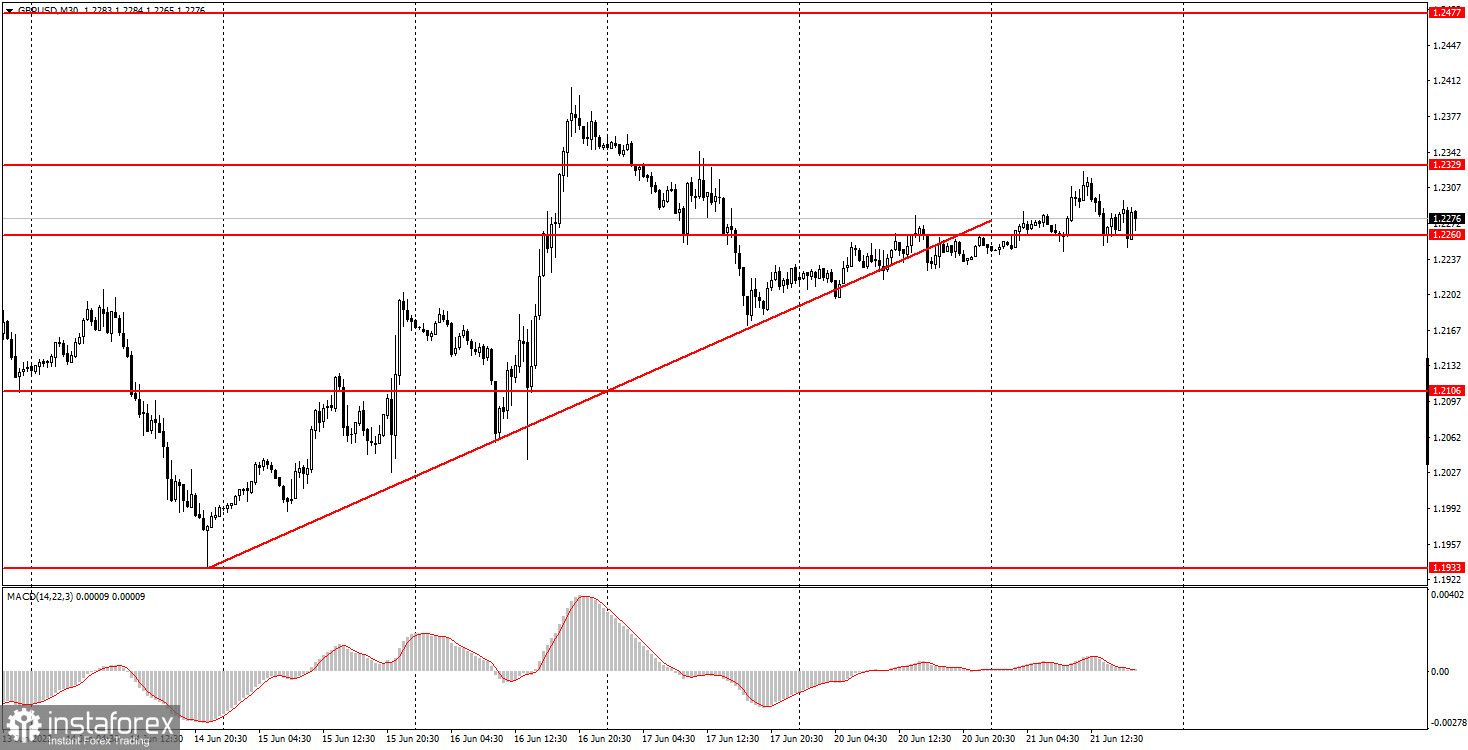
The GBP/USD pair showed absolutely nothing on Tuesday. If the euro at least tried to continue growing, the pound did not even do that and ended the day near the opening levels of the day. The ascending trend line has already been canceled, and the whole movement has become more like a flat with a slight upward slope. That is, the trend seems to be there, but it is so weak that it is extremely problematic to work it out. Just like the European Union and America, there was not a single significant event in the UK during the day. There is news of a political and geopolitical nature, but so far they have no effect on the pair's movement. Perhaps in the future the conflict between the European Union and the UK will have a negative impact on the pound. Or the possible withdrawal of Scotland from the UK. But not now. Thus, the British currency is also climbing up with all its might, but it is not doing well. There will be exactly one more important event in the UK this week than in Europe. The inflation report is a really important event and will be released tomorrow.
5M chart of the GBP/USD pair
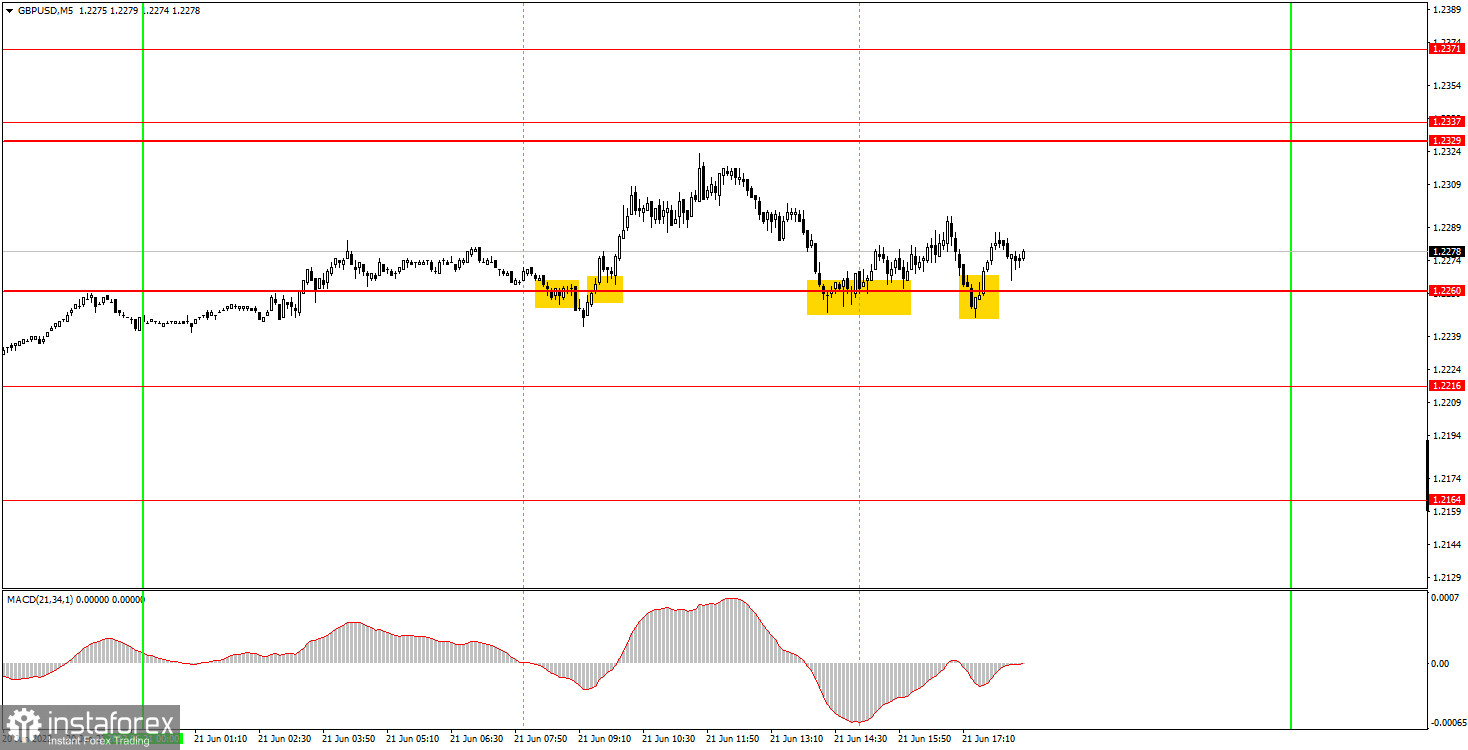
It is clearly seen on the 5-minute timeframe that the movements during the day again left much to be desired. The market's attempt to take the pair up at the European trading session was offset by bears at the same session. As a result, the currency pair spent most of the day near the level of 1.2260, around which all trading signals were formed. The first, like all subsequent ones, turned out to be false. We warned in recent articles that movements can be as flat as possible, which is what we end up with. Novice traders received a loss of about 25 points on the first sell signal, since the pair did not go in the right direction by even 10 points. The next signal was slightly better, as after its formation the price almost reached the target level of 1.2329, stopping just 5 points away from it. Five points is not an error, but given the high probability of a flat, beginners could close this position manually. At least they closed the loss on the first trade. Then two more buy signals were formed near the level of 1.2260, which should not have been worked out, since the first two were recognized as false.
How to trade on Wednesday:
We formally have an upward trend and a trend line on the 30-minute timeframe, but the trend line is no longer relevant. Thus, for some time the pound may continue its convulsions in an attempt to rise in price against the dollar, but all this looks very unconvincing. The situation may change on Wednesday due to a stronger fundamental and macroeconomic background, but it is unlikely that the British currency will suddenly receive strong support and grow by 100 points. It is recommended to trade on the 5-minute TF at the levels of 1.2164, 1.2216, 1.2260 , 1.2329-1.2337, 1.2371. When the price passes after opening a deal in the right direction for 20 points, Stop Loss should be set to breakeven. The UK is set to release its May inflation report, and this is the most important event of the day and week. Then we have Federal Reserve Chairman Jerome Powell's speech in America, which is also important, but it is unlikely that he will tell the market anything new.
Basic rules of the trading system:
1) The signal strength is calculated by the time it took to form the signal (bounce or overcome the level). The less time it took, the stronger the signal.
2) If two or more deals were opened near a certain level based on false signals (which did not trigger Take Profit or the nearest target level), then all subsequent signals from this level should be ignored.
3) In a flat, any pair can form a lot of false signals or not form them at all. But in any case, at the first signs of a flat, it is better to stop trading.
4) Trade deals are opened in the time period between the beginning of the European session and until the middle of the American one, when all deals must be closed manually.
5) On the 30-minute TF, using signals from the MACD indicator, you can trade only if there is good volatility and a trend, which is confirmed by a trend line or a trend channel.
6) If two levels are located too close to each other (from 5 to 15 points), then they should be considered as an area of support or resistance.
On the chart:
Support and Resistance Levels are the Levels that serve as targets when buying or selling the pair. You can place Take Profit near these levels.
Red lines are the channels or trend lines that display the current trend and show in which direction it is better to trade now.
The MACD indicator (14,22,3) consists of a histogram and a signal line. When they cross, this is a signal to enter the market. It is recommended to use this indicator in combination with trend lines (channels and trend lines).
Important speeches and reports (always contained in the news calendar) can greatly influence the movement of a currency pair. Therefore, during their exit, it is recommended to trade as carefully as possible or exit the market in order to avoid a sharp price reversal against the previous movement.
Beginners on Forex should remember that not every single trade has to be profitable. The development of a clear strategy and money management are the key to success in trading over a long period of time.


