


Trend analysis
EUR/USD will try to continue moving up this week, from 1.0555 (closing of the last weekly candle) to 1.0623, which is the 61.8% retracement level (yellow dotted line). Then, it will go to the historical resistance level at 1.0695 (blue dotted line).
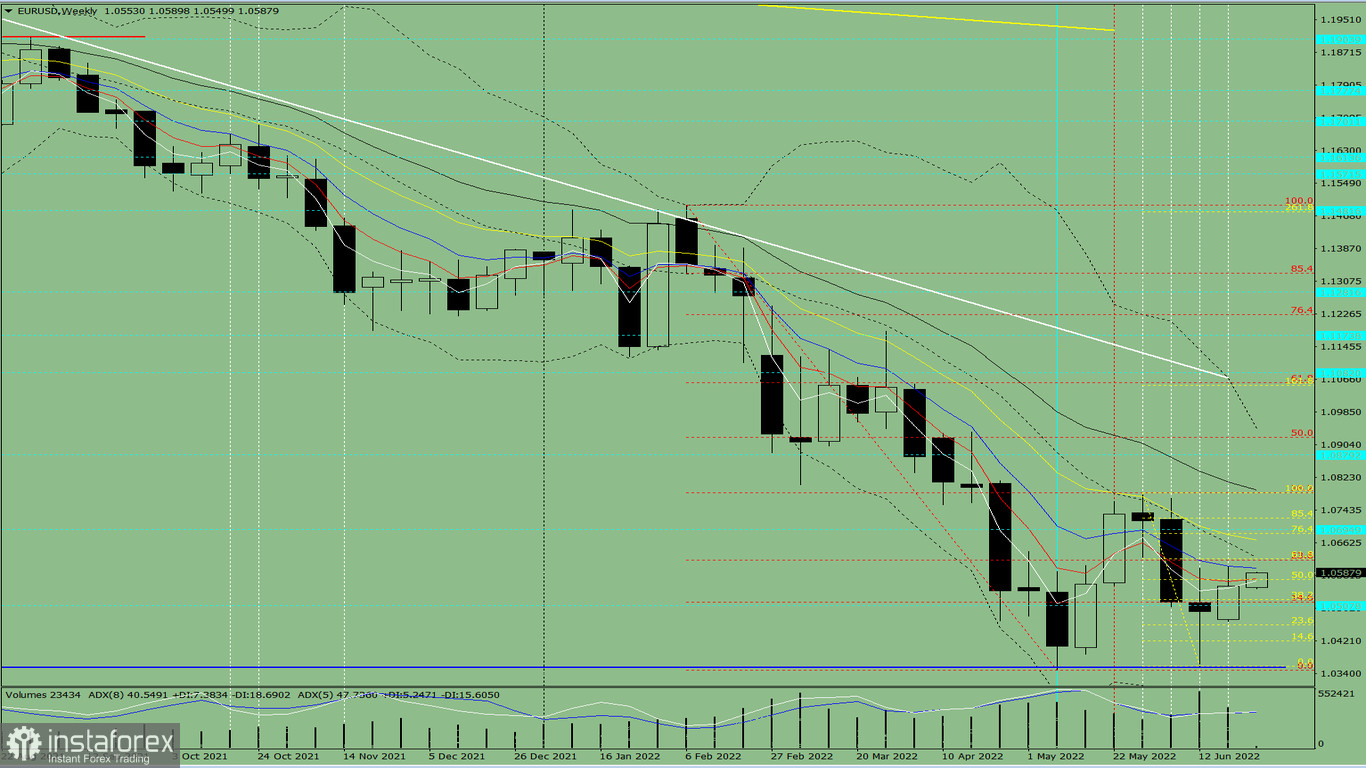
Fig. 1 (weekly chart)
Comprehensive analysis:
Indicator analysis - uptrend
Fibonacci levels - uptrend
Volumes - uptrend
Candlestick analysis - uptrend
Trend analysis - uptrend
Bollinger bands - uptrend
Monthly chart - uptrend
All this points to an upward movement in EUR/USD.
Conclusion: The pair will have an upward trend, with no first lower shadow on the weekly white candle (Monday - up) and no second upper shadow (Friday - up).
And during the week, the quote will rise from 1.0555 (closing of the last weekly candle) to the 61.8% retracement level at 1.0623 (yellow dotted line), then move to the historical resistance level at 1.0695 (blue dotted line).
Alternatively, the pair could attempt to move up from 1.0555 (closing of the last weekly candle) to the 61.8% retracement level at 1.0623 (yellow dotted line), then go down to the historical support level at 1.0508 (dashed blue line). After that the price may continue the uptrend.


