


Trend analysis
GBP/USD will attempt to move up this week, from 1.2269 (closing of the last weekly candle) to 1.2360 - the 23.6% retracement level (red dotted line). Then, it will go to the 23.6% retracement level at 1.2477 (yellow dotted line), before rolling back downwards.
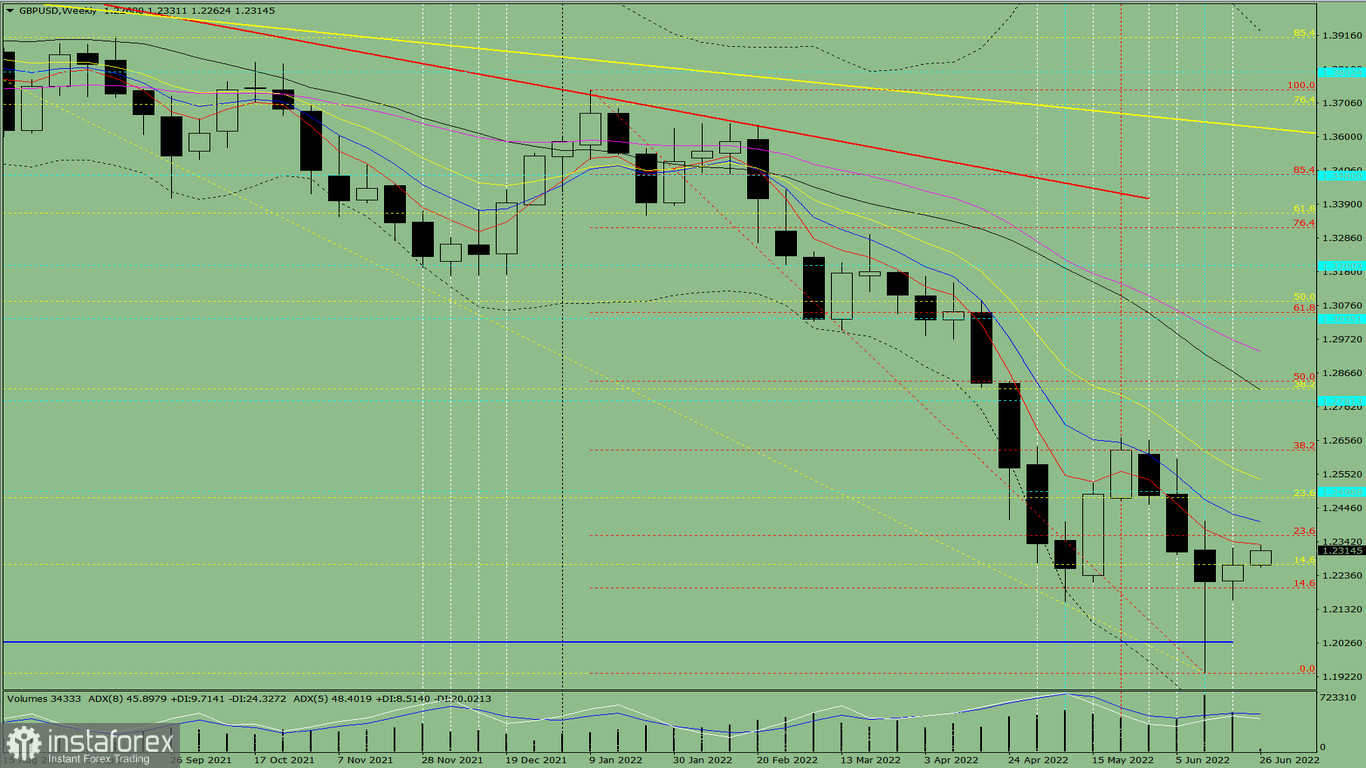
Fig. 1 (weekly chart)
comprehensive analysis:
Indicator analysis - uptrend
Fibonacci levels - uptrend
Volumes - uptrend
Candlestick analysis - uptrend
Trend analysis - uptrend
Bollinger bands - uptrend
Monthly chart - uptrend
All this points to an upward movement in GBP/USD.
Conclusion: The pair will have an upward trend, with no first lower shadow on the weekly white candle (Monday - up) and no second upper shadow (Friday - up).
And during the week, the price will rise from 1.2360 (closing of the last weekly candle) to the 23.6% retracement level at 1.2360 (red dotted line), move to the 23.6% retracement level at 1.2477 (yellow dotted line), then rollback downwards
Alternatively, the pair may climb up from 1.2269 (closing of the last weekly candle) to the 23.6% retracement level at 1.2360 (red dotted line), bounce back to the support level at 1.2030 (blue thick line), then go to the 14.6 % retracement level at 1.2197 (red dotted line).


