


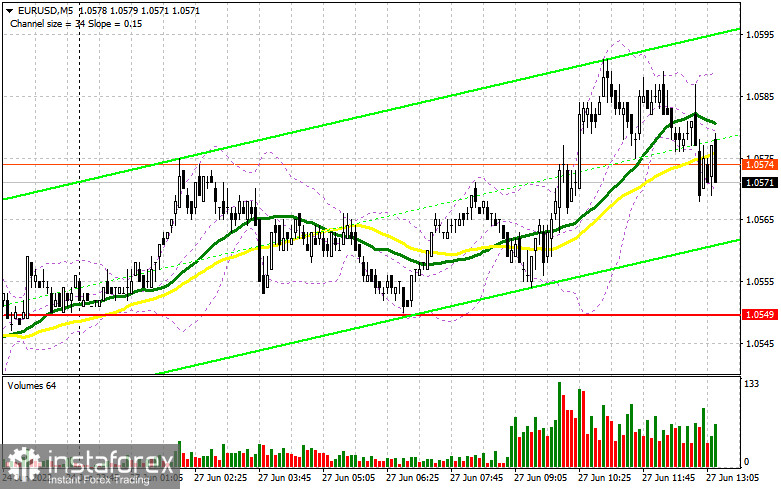
In my morning forecast, I paid attention to the 1.0603 level and recommended making decisions on entering the market from it. Let's look at the 5-minute chart and figure out what happened there. In the first half of the day, euro buyers made another unsuccessful attempt to grow to the area of last week's maximum of 1.0603. As a result, it was not possible to reach this level, as well as it was not possible to get a false breakout to open short positions. Against this background, the technical picture, as well as the strategy itself, remained unchanged. And what were the entry points for the pound?
To open long positions on EURUSD, you need:
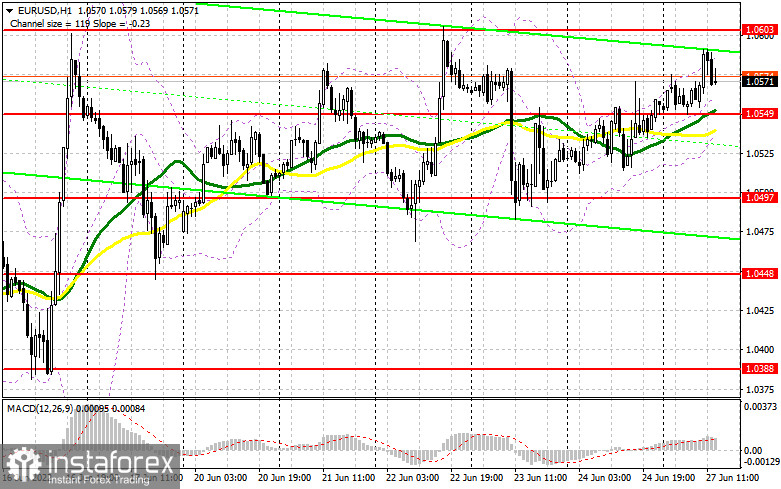
During the American session, data on orders for long-term goods in the United States are released, which may lead to a small spike in market volatility. Weak indicators will indicate the presence of problems in the economy since the obvious unwillingness of the population to make expensive purchases is one of the signs of upcoming difficulties. Quite high prices can also harm the indicator, the growth of which will continue in the near future. In the case of a good report, which will be quite surprising for the market, as well as a decline in the pair, the key task of the bulls will be to protect the nearest level of 1.0549, which acts as the middle boundary of the side channel. Moving averages pass in the area of this range, therefore, the formation of a false breakdown there forms a signal to open long positions in the hope of trying to regain the 1.0603 area – the upper limit. A breakout and a top-down test of 1.0603 in the afternoon will deal a very strong blow to the bears' stop orders, which will allow the pair to break out of the side channel with the possibility of updating 1.0640 and building a new upward trend to 1.0663 and 1.0687. A more distant target will be the 1.0714 area, where I recommend fixing the profits. With the option of a decline in EUR/USD and the absence of buyers at 1.0549, which is more likely, nothing terrible will happen – everything will return to its place. In this case, I advise you not to rush into the market: the best option for opening long positions will be a false breakdown in the support area of 1.0497. I advise buying EUR/USD immediately for a rebound only from the level of 1.0438, or even lower – around 1.0388 with the aim of an upward correction of 30-35 points within a day.
To open short positions on EURUSD, you need:
The fact that the bears did not let the pair into the 1.0603 area, keeps them a fairly good chance of returning the market to their control. In the event of a re-growth of the euro in the afternoon after weak data on the volume of orders for durable goods, as well as a poor index of pending sales in the real estate market, only the formation of a false breakdown at 1.0603 forms a signal to open short positions with the prospect of a return to the middle of the 1.0549 side channel. A breakdown and consolidation below this range, as well as a reverse test from the bottom up – all this will lead to an additional sell signal with the demolition of buyers' stop orders and a larger movement of the pair down to the 1.0497 area. A more serious struggle will unfold for this level, since issuing EUR/USD lower will be "suicide" for buyers. A breakthrough and a reverse test of 1.0497 from the bottom up will be evidence of a resumption of the bearish trend with the prospect of a rapid decline at 1.0448, where I recommend completely exiting sales. A more distant target will be the 1.0388 area. In case of an upward movement of EUR/USD during the European session, as well as the absence of bears at 1.0603, I advise you to postpone short positions to the next attractive level of 1.0640. In the formation of a false breakdown, there will be a new starting point for the downward correction of the pair. You can sell EUR/USD immediately on a rebound from the maximum of 1.0663, or even higher – around 1.0687 with the aim of a downward correction of 30-35 points.
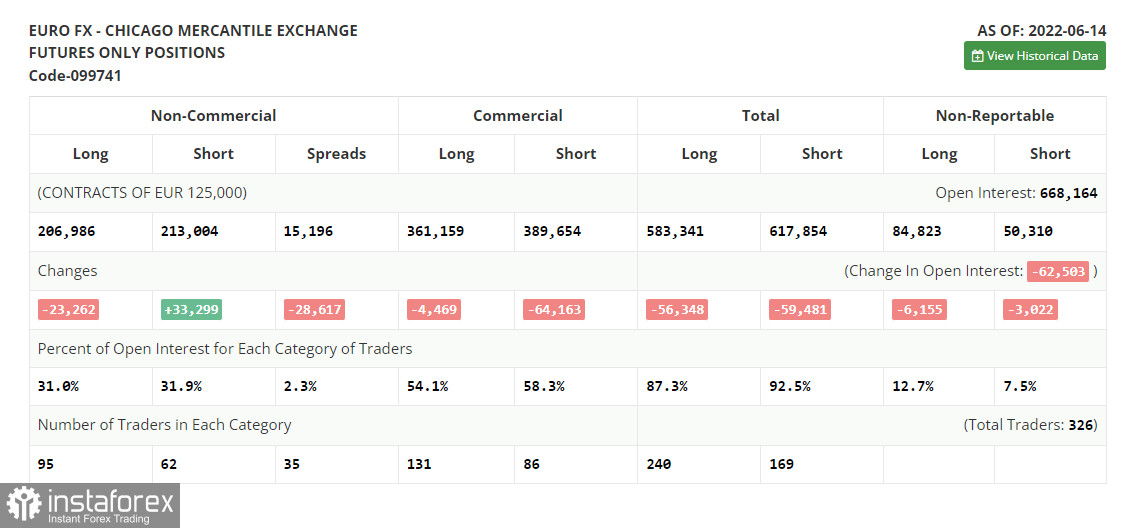
The COT report (Commitment of Traders) for June 14 recorded a sharp reduction in long positions and an increase in short positions, which led to the formation of a negative delta, indicating the formation of bearish sentiment. The meeting of the European Central Bank remained in the past and all the emphasis was on the decision of the Federal Reserve System, which raised interest rates immediately by 0.75%, declaring the continuation of a tough fight against inflation in the United States. The fact that politicians continue to pursue a tight monetary policy forces traders to get rid of risky assets and buy the dollar, which leads to its strengthening. Most likely, this trend will continue, since no one is going to abandon measures to combat inflation through an increase in interest rates yet. The COT report indicated that long non-commercial positions decreased by 23,262 to the level of 206,986, while short non-commercial positions jumped by 33,299 to the level of 213,004. Despite the low exchange rate of the euro, this does not make it particularly attractive, since traders choose the US dollar. At the end of the week, the total non-commercial net position turned negative and decreased from 50,543 to -6,018. The weekly closing price dropped to 1.0481 against 1.0710.
Signals of indicators:
Moving averages
Trading is just above 30 and 50 daily moving averages, which indicates an attempt by the bulls to return to the market.
Note: The period and prices of moving averages are considered by the author on the hourly chart H1 and differ from the general definition of the classic daily moving averages on the daily chart D1.
Bollinger Bands
In the case of a decline, the lower limit of the indicator around 1.0530 will act as support.
Description of indicators
- Moving average (moving average determines the current trend by smoothing out volatility and noise). Period 50. The graph is marked in yellow.
- Moving average (moving average determines the current trend by smoothing out volatility and noise). Period 30. The graph is marked in green.
- MACD indicator (Moving Average Convergence / Divergence - moving average convergence/divergence) Fast EMA period 12. Slow EMA period 26. SMA period 9
- Bollinger Bands (Bollinger Bands). Period 20
- Non-profit speculative traders, such as individual traders, hedge funds, and large institutions use the futures market for speculative purposes and to meet certain requirements.
- Long non-commercial positions represent the total long open position of non-commercial traders.
- Short non-commercial positions represent the total short open position of non-commercial traders.
- Total non-commercial net position is the difference between the short and long positions of non-commercial traders.


